
Page 62 - DP-2-3
P. 62
Design+ Design chatbot using activity theory
Figure 5. Conversational flow of road sign chatbot
Source: Engati.com.
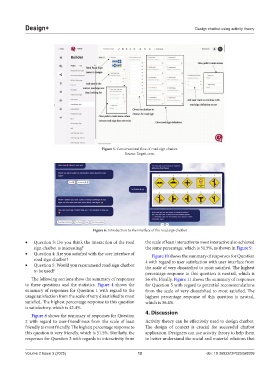
Figure 6. Introduction to the interface of the road sign chatbot
• Question 3: Do you think the interaction of the road the scale of least interactive to most interactive also achieved
sign chatbot is interesting? the same percentage, which is 51.5%, as shown in Figure 9.
• Question 4: Are you satisfied with the user interface of Figure 10 shows the summary of responses for Question
road sign chatbot? 4 with regard to user satisfaction with user interface from
• Question 5: Would you recommend road sign chatbot the scale of very dissatisfied to most satisfied. The highest
to be used?
percentage response to this question is neutral, which is
The following sections show the summary of responses 36.4%. Finally, Figure 11 shows the summary of responses
to these questions and the statistics. Figure 4 shows the for Question 5 with regard to potential recommendations
summary of responses for Question 1 with regard to the from the scale of very dissatisfied to most satisfied. The
usage satisfaction from the scale of very dissatisfied to most highest percentage response of this question is neutral,
satisfied. The highest percentage response to this question which is 36.4%.
is satisfactory, which is 42.4%.
4. Discussion
Figure 8 shows the summary of responses for Question
2 with regard to user-friendliness from the scale of least Activity theory can be effectively used to design chatbot.
friendly to most friendly. The highest percentage response to The design of context is crucial for successful chatbot
this question is very friendly, which is 51.5%. Similarly, the application. Designers can use activity theory to help them
responses for Question 3 with regards to interactivity from to better understand the social and material relations that
Volume 2 Issue 3 (2025) 12 doi: 10.36922/DP025060009