
Page 27 - EER-1-1
P. 27
Explora: Environment
and Resource WTW emissions of road and rail transport
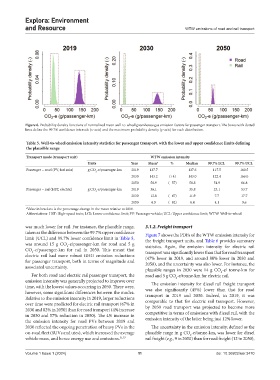
Figure 6. Probability density functions of normalized mean well-to-wheel greenhouse gas emission factors for passenger transport. The boxes with dotted
lines define the 99.7% confidence intervals (x-axis) and the maximum probability density (y-axis) for each distribution.
Table 5. Well‑to‑wheel emission intensity statistics for passenger transport, with the lower and upper confidence limits defining
the plausible range
Transport mode (transport unit) WTW emission intensity
Units Year Mean a % Median 99.7% LCL 99.7% UCL
Passenger – road (PV, fuel mix) g CO -e/passenger-km 2019 137.7 137.6 117.5 160.5
2
2030 143.2 (+4) 143.0 122.4 166.0
2050 58.9 (−57) 58.8 51.9 66.8
Passenger – rail (HST, electric) g CO -e/passenger-km 2019 36.1 35.8 23.1 53.7
2
2030 12.0 (−67) 11.9 7.7 17.7
2050 6.5 (−82) 6.4 4.1 9.6
a Value in brackets is the percentage change in the mean relative to 2019.
Abbreviations: HST: High-speed train; LCL: Lower confidence limit; PV: Passenger vehicle; UCL: Upper confidence limit; WTW: Well-to-wheel.
was much lower for rail. For instance, the plausible range, 3.1.2. Freight transport
taken as the difference between the 99.7% upper confidence Figure 7 shows the PDFs of the WTW emission intensity for
limit (UCL) and 99.7% lower confidence limit in Table 5, the freight transport units, and Table 6 provides summary
was around 15 g CO -e/passenger-km for road and 5 g statistics. Again, the emission intensity for electric rail
2
CO -e/passenger-km for rail in 2050. This meant that transport was significantly lower than that for road transport
2
electric rail had more robust GHG emission reductions (47% lower in 2019, and around 80% lower in 2030 and
for passenger transport, both in terms of magnitude and 2050), and the uncertainty was also lower. For instance, the
associated uncertainty.
plausible ranges in 2030 were 14 g CO -e/ tonne-km for
2
For both road and electric rail passenger transport, the road and 5 g CO -e/tonne-km for electric rail.
emission intensity was generally projected to improve over 2
The emission intensity for diesel rail freight transport
time, with the lowest values occurring in 2050. There were, was also significantly (45%) lower than that for road
however, some significant differences between the modes. transport in 2019 and 2030. Indeed, in 2019, it was
Relative to the emission intensity in 2019, larger reductions
over time were predicted for electric rail transport (67% in comparable to that for electric rail transport. However,
2030 and 82% in 2050) than for road transport (4% increase by 2050 road transport was projected to become more
competitive in terms of emissions with diesel rail, with the
in 2030 and 57% reduction in 2050). The 4% increase in
the emission intensity for road PVs between 2019 and emission intensity of the latter being just 12% lower.
2030 reflected the ongoing penetration of heavy PVs in the The uncertainty in the emission intensity, defined as the
on-road fleet (SUVs and utes), which increased the average plausible range in g CO -e/tonne-km, was lower for diesel
2
vehicle mass, and hence energy use and emissions. 31,37 rail freight (e.g., 9 in 2050) than for road freight (12 in 2050),
Volume 1 Issue 1 (2024) 11 doi: 10.36922/eer.3470