
Page 25 - EER-1-1
P. 25
Explora: Environment
and Resource WTW emissions of road and rail transport
absence of detailed data on average train occupancy (φ (rail,p) ), based on the computed emissions performance and
a triangular distribution with a plausible range was also load characteristics for diesel freight trains. Diesel fuel
29
assumed (T: 0.75, 0.95, 0.84). The number of passengers parameters (lower heating value of 42.68 MJ/kg, and carbon
per train was then calculated by combining the distributions content of 3.16 g CO /g fuel), along with a diesel engine
2
of capacity and occupancy in a Monte Carlo simulation. The to electric efficiency improvement factor (γ, T: 0.30, 0.45,
weight per individual passenger, in kg and including luggage, 0.35), were used to convert the derived diesel consumption
was defined as a uniform distribution (U: 90, 100). (g/train-km) to electricity required (kWh/ train-km). This
was subsequently combined with the grid-loss-corrected
A relationship between train capacity (seats) and emission intensity of the grid (ε , Table 3) and payload
unladen train weight was also derived from the review. Total to simulate the GHG emissions performance for electric
grid
train weight was determined by adding the total mass of all freight.
passengers to the empty weight of the train, both of which
could be defined as a function of train capacity. It was found The distance distribution for rail freight transport was
that the passenger weight was between around 7% and 10% taken to be the same as that for rail passenger transport.
of the total train mass, and the variation in passenger mass The average payload (P) for freight trains was assumed
due to variation in mean occupancy was around 1 – 2% of to be 1700 tonnes in 2019/2030 and 2,800 tonnes in 2050,
the total weight. It was, therefore, concluded that, as with based on the data presented in. The variability in payload
10
PVs, the passenger mass correction factor could be set to (θ (rail,f) ) was modeled as a triangular distribution (T: 700,
unity, and that train energy consumption and occupancy 2,800, 1,700) in 2019/2030 and (T: 1,800, 3,800, 2,800) in
could be modeled as independent variables. 2050. The impact of changing payload on the emission
factor was modeled as follows:
2.5.3. Rail freight transport
ω = (P + 1,750)/3,450 for 2019 and 2030 (III)
For freight transport, both diesel and electric trains were (rail, f)
considered, with direct emissions being calculated for ω (rail, f) = (P + 2,700)/5,500 for 2050 (IV)
diesel only. 2.6. Simulation of indirect emissions
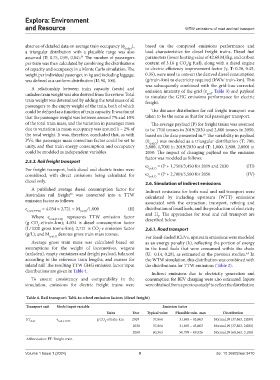
A published average diesel consumption factor for Indirect emissions for both road and rail transport were
Australian rail freight was converted into a TTW calculated by including upstream (WTT) emissions
30
emission factor as follows: associated with the extraction, transport, refining and
e (rail,f,TTW) = 4.034 × 2,721 × M (rail,f) /1,000 (II) distribution of fossil fuels, and the production of electricity
Where e (rail,f,TTW) represents TTW emission factor and H . The approaches for road and rail transport are
2
(g CO -e/train-km); 4.034 is diesel consumption factor described below.
2
(L/1000 gross tonne-km); 2,721 is CO -e emission factor 2.6.1. Road transport
2
(g/L); and M (rail, f) denotes gross train mass tonnes. For fossil-fueled ICEVs, upstream emissions were modeled
Average gross train mass was calculated based on as an energy penalty (λ), reflecting the portion of energy
assumptions for the weight of locomotives, wagons in the fossil fuels that were consumed within the chain
(unladen), empty containers and freight payload, balanced (U: 0.14, 0.28), as estimated in the previous studies. In
5,8
according to the reference train lengths, and masses for the WTW simulation, this distribution was combined with
inland rail. The resulting TTW GHG emission factor input the distributions for TTW emissions (Table 2).
distributions are given in Table 4.
Indirect emissions due to electricity generation and
To ensure consistency and comparability in the consumption for BEV charging were also estimated. Inputs
simulation, emissions for electric freight trains were were obtained from a previous study to reflect the distribution
8
Table 4. Rail transport: Tabk‑to‑wheel emission factors (diesel freight)
Transport unit Model input variable Emission factor
Units Year Typical value Plausible min‑ max Distribution
FT e g CO -e/train-km 2019 37,864 31,865 – 43,863 Normal, N (37,863, 2,000)
diesel (rail, f, TTW) 2
2030 37,864 31,865 – 43,863 Normal, N (37,863, 2,000)
2050 60,363 50,799 – 69,926 Normal, N (60,363, 3,188)
Abbreviation: FT: Freight train.
Volume 1 Issue 1 (2024) 9 doi: 10.36922/eer.3470