
Page 28 - EER-1-1
P. 28
Explora: Environment
and Resource WTW emissions of road and rail transport
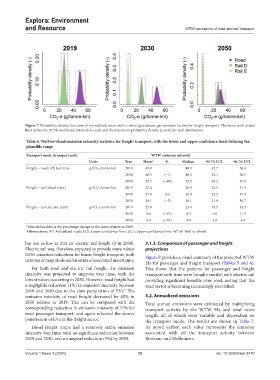
Figure 7. Probability density functions of normalized mean well-to-wheel greenhouse gas emission factors for freight transport. The boxes with dotted
lines define the 99.7% confidence intervals (x-axis) and the maximum probability density (y-axis) for each distribution.
Table 6. Well‑to‑wheel emission intensity statistics for freight transport, with the lower and upper confidence limit defining the
plausible range
Transport mode (transport unit) WTW emission intensity
Units Year Mean a % Median 99.7% LCL 99.7% UCL
Freight – road (AT, fuel mix) g CO -e/tonne-km 2019 49.0 48.9 42.7 56.6
2
2030 48.3 (−1) 48.2 42.1 56.1
2050 29.5 (−40) 29.5 24.2 35.8
Freight – rail (diesel train) g CO -e/tonne-km 2019 27.0 26.9 22.5 31.9
2
2030 27.0 (0) 26.9 22.5 31.9
2050 26.1 (−3) 26.1 21.8 30.7
Freight – rail (electric train) g CO -e/tonne-km 2019 25.8 25.6 19.5 33.7
2
2030 8.6 (−67) 8.5 6.6 11.3
2050 5.0 (−81) 4.9 3.8 6.4
a Value in brackets is the percentage change in the mean relative to 2019.
Abbreviations: AT: Articulated truck; LCL: Lower confidence limit; UCL: Upper confidence limit; WTW: Well-to-wheel.
but not as low as that for electric rail freight (3 in 2050). 3.1.3. Comparison of passenger and freight
Electric rail was, therefore, expected to provide more robust projections
GHG emission reductions for future freight transport, both Figure 8 provides a visual summary of the projected WTW
in terms of magnitude and in terms of associated uncertainty.
EIs for passenger and freight transport (Tables 5 and 6).
For both road and electric rail freight, the emission This shows that the patterns for passenger and freight
intensity was projected to improve over time, with the transport with time were broadly similar, with electric rail
lowest values occurring in 2050. However, road freight had providing significant benefits over road, noting that the
a negligible reduction (1%) in emission intensity between road sector is becoming increasingly electrified.
2019 and 2030 due to the slow penetration of EVs. The
5
emission intensity of road freight decreased by 40% in 3.2. Annualized emissions
2050 relative to 2019. This can be compared with the Total annual emissions were estimated by multiplying
corresponding reduction in emission intensity of 57% for transport activity by the WTW EIs and total route
road passenger transport, and again reflected the slower length, all of which were variable and dependent on
penetration of EVs in the freight sector. the transport mode. The results are shown in Table 7.
Diesel freight trains had a relatively stable emission As noted earlier, each value represents the emission
intensity over time, with no significant reduction between associated with all the transport activity between
2019 and 2030, and a marginal reduction (3%) by 2050. Brisbane and Melbourne.
Volume 1 Issue 1 (2024) 12 doi: 10.36922/eer.3470