
Page 23 - EER-1-1
P. 23
Explora: Environment
and Resource WTW emissions of road and rail transport
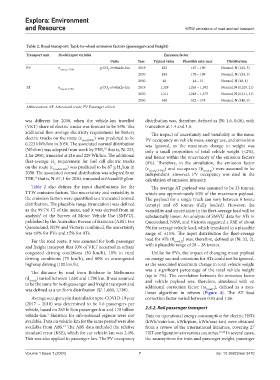
Table 2. Road transport: Tank‑to‑wheel emission factors (passengers and freight)
Transport unit Model input variable Emission factor
Units Year Typical value Plausible min‑max Distribution
PV e (road, p, TTW) g CO -e/vehicle-km 2019 182 167 – 196 Normal, N (182, 5)
2
2030 184 170 – 199 Normal, N (184, 5)
2050 48 44 – 51 Normal, N (48, 1)
AT e g CO -e/vehicle-km 2019 1,329 1,265 – 1,392 Normal, N (1,329, 21)
(road, f, TTW) 2
2030 1,311 1,248 – 1,373 Normal, N (1,311, 21)
2050 548 522 – 574 Normal, N (548, 9)
Abbreviations: AT: Articulated truck; PV: Passenger vehicle.
was different for 2050, when the vehicle-km travelled distribution was, therefore, defined as (N: 1.6, 0.06), with
(VKT) share of electric trucks was forecast to be 55%. The truncation at 1.4 and 1.8.
additional fleet-average electricity requirement for battery The impact of uncertainty and variability in the mean
electric trucks on the route (e (road,BEV) ) was predicted to be PV occupancy on vehicle mass, energy use, and emissions
0.223 kWh/km in 2050. The associated normal distribution was ignored, as the maximum change in weight was
(Wh/km) was adopted from work by TER, that is, N: 223, only a small proportion of total vehicle weight (<2%),
16
2 for 2050, truncated at 216 and 229 Wh/km. The additional and hence within the uncertainty of the emission factors
fleet-average H requirement for fuel cell electric trucks (8%). Therefore, in the simulation, the emission factor
2
on the route (c (road,FCEV) ) was predicted to be 67 g H /km in (e ) and occupancy (φ ) were assumed to be
2
(road,p)
(road,p,TTW)
2050. The associated normal distribution was adopted from independent. However, PV occupancy was used in the
TER, that is, N: 67, 1 for 2050, truncated at 65 and 69 g/km. calculation of emission intensity.
16
Table 2 also defines the input distributions for the The average AT payload was assumed to be 33 tonnes,
TTW emission factors. The uncertainty and variability in which was approximately 50% of the maximum payload.
the emission factors were quantified as a truncated normal The payload for a single truck can vary between 0 tonne
distribution. The plausible range (truncation) was defined (empty) and 65 tonnes (fully loaded). However, the
as the 99.7% CI of the mean, and it was derived from an variability and uncertainty in the fleet-average load will be
analysis of the Survey of Motor Vehicle Use (SMVU), substantially lower. An analysis of SMVU data for ATs in
8
published by the Australian Bureau of Statistics (ABS). For Queensland, NSW, and Victoria suggested a RSE of about
Queensland, NSW and Victoria combined, the uncertainty 5% for average vehicle load, which translated to a plausible
was ±8% for PVs and ±5% for ATs. range of ±15%. The input distribution for fleet-average
For the road route, it was assumed for both passenger load for ATs (θ (road,f) ) was, therefore, defined as (N: 33, 2),
and freight transport that 10% of VKT occurred in urban/ with a plausible range of 28 – 38 tonnes.
congested driving conditions (30 km/h), 10% in rural Unlike for PVs, the impact of changing mean payload
driving conditions (75 km/h), and 80% in uncongested on energy use and emissions for ATs could not be ignored,
highway driving (100 km/h). as the associated maximum change in total vehicle weight
was a significant percentage of the total vehicle weight
The distance by road from Brisbane to Melbourne
(d (road) ) varied between 1,660 and 1,780 km. It was assumed (up to 7%). The correlation between the emission factor
and vehicle payload was, therefore, simulated with an
to be the same for both passenger and freight transport and additional correction factor (ω ), defined as a non-
was defined as a uniform distribution (U: 1,660, 1,780). (road,f)
linear algorithm in n0vem (Figure 4). The AT load
Average occupancy in Australia for a pre-COVID-19 year correction factor varied between 0.95 and 1.06.
(2017 – 2018) was determined to be 1.6 passengers per
vehicle, based on 283 billion passenger-km and 178 billion 2.5.2. Rail passenger transport
3
vehicle-km. Statistics for sub-national regions were not Data on operational energy consumption for electric HSTs
available. Data on vehicle-km for the same period were also (kWh/train-km, kWh/pkm, kWh/seat-km) were obtained
available from ABS. The ABS data included the relative from a review of the international literature, covering 27
17
standard error (RSE), which for car vehicle-km was 2.4%. HST configurations in various countries. 18-28 In several cases,
This was also applied to passenger-km. The PV occupancy the assumptions for train and passenger weight, passenger
Volume 1 Issue 1 (2024) 7 doi: 10.36922/eer.3470