
Page 19 - EER-1-1
P. 19
Explora: Environment
and Resource WTW emissions of road and rail transport
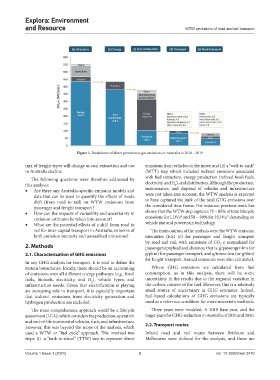
Figure 1. Breakdown of direct greenhouse gas emissions in Australia in 2018 – 2019
mix of freight types will change as coal extraction and use emissions from vehicles on the move, and (ii) a “well-to-tank”
in Australia decline. (WTT) step which included indirect emissions associated
The following questions were therefore addressed by with fuel extraction, energy production (refined fossil fuels,
this analysis: electricity, and H ), and distribution. Although the production,
2
• Are there any Australia-specific emission models and maintenance, and disposal of vehicles and infrastructure
data that can be used to quantify the effects of mode were not taken into account, the WTW analysis is expected
shift (from road to rail) on WTW emissions from to have captured the bulk of the total GHG emissions over
passenger and freight transport? the considered time frame. For instance, previous work has
• How can the impacts of variability and uncertainty in shown that the WTW step captures 75 – 85% of total lifecycle
9
8
emission estimates be taken into account? emissions for LDVs and 50 – 90% for HDVs, depending on
• What are the potential effects of a shift from road to vehicle size and powertrain technology.
rail for inter-capital transport in Australia, in terms of The main outputs of the analysis were the WTW emission
both emission intensity and annualized emissions? intensities (EIs) (ε) for passenger and freight transport
by road and rail, with emissions of CO -e normalized for
2. Methods passengers/payload and distance, that is, g/passenger-km (or
2
2.1. Characterization of GHG emissions g/pkm) for passenger transport, and g/tonne-km (or g/tkm)
for freight transport. Annual emissions were also calculated.
In any GHG analysis for transport, it is vital to define the
system boundaries. Ideally, there should be an accounting Where GHG emissions are calculated from fuel
of emissions over all different energy pathways (e.g., fossil consumption, as in this analysis, there will be some
fuels, biofuels, electricity, and H ), vehicle types, and uncertainty in the results due to the regional variation in
2
infrastructure needs. Given that electrification is playing the carbon content of the fuel. However, this is a relatively
an increasing role in transport, it is especially important small source of uncertainty in GHG estimates. Indeed,
that indirect emissions from electricity generation and fuel-based calculations of GHG emissions are typically
hydrogen production are included. used as a reference condition for more uncertain methods.
The most comprehensive approach would be a lifecycle Three years were modeled: A 2019 base year, and the
assessment (LCA), which considers the production, operation target years for GHG-reduction in Australia of 2030 and 2050.
and end-of-life treatment of vehicles, fuels, and infrastructure.
However, this was beyond the scope of the analysis, which 2.2. Transport routes
used a WTW or “fuel cycle” approach. This involved two Inland road and rail routes between Brisbane and
steps: (i) a “tank-to-wheel” (TTW) step to represent direct Melbourne were defined for the analysis, and these are
Volume 1 Issue 1 (2024) 3 doi: 10.36922/eer.3470