
Page 20 - EER-1-1
P. 20
Explora: Environment
and Resource WTW emissions of road and rail transport
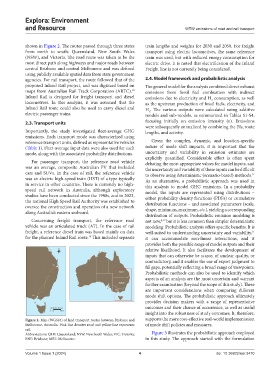
shown in Figure 2. The routes passed through three states train lengths and weights for 2030 and 2050. For freight
from north to south: Queensland, New South Wales transport using electric locomotives, the same reference
(NSW), and Victoria. The road route was taken to be the train was used, but with reduced energy consumption for
most direct path along highways and major roads between electric drive. It is noted that electrification of the Inland
central Brisbane and central Melbourne and was defined Freight line is not currently being considered.
using publicly available spatial data from state government
agencies. For rail transport, the route followed that of the 2.4. Model framework and probabilistic analysis
proposed Inland Rail project, and was digitized based on The general model for the analysis combined direct exhaust
maps from Australian Rail Track Corporation (ARTC). emissions from fossil fuel combustion with indirect
10
Inland Rail is designed for freight transport and diesel emissions due to electricity and H consumption, as well
2
locomotives. In this analysis, it was assumed that the as the upstream production of fossil fuels, electricity, and
Inland Rail route could also be used to carry diesel and H . The various outputs were calculated using additive
2
electric passenger trains. models and sub-models, as summarized in Tables S1-S4,
2.3. Transport units focusing initially on emission intensity (ε). Emissions
were subsequently annualized by combining the EIs, route
Importantly, the study investigated fleet-average GHG lengths, and activity.
emissions. Each transport mode was characterized using
reference transport units, defined as representative vehicles Given the complex, dynamic, and location-specific
(Table 1). Fleet-average input data were also used for each nature of mode shift impacts, it is important that the
mode, along with the associated probability distributions. uncertainty and variability in emission estimates are
explicitly quantified. Considerable effort is often spent
For passenger transport, the reference road vehicle debating the most appropriate values for model inputs, and
was an average, composite Australian PV that included the uncertainty and variability of these inputs can be difficult
cars and SUVs. In the case of rail, the reference vehicle to observe using deterministic (scenario-based) methods.
11
was an electric high-speed train (HST) of a type typically As an alternative, a probabilistic approach was used in
in service in other countries. There is currently no high- this analysis to model GHG emissions. In a probability
speed rail network in Australia, although exploratory model, the inputs are represented using distributions –
studies have been conducted since the 1980s, and in 2023, either probability density functions (PDFs) or cumulative
the national High Speed Rail Authority was established to distribution functions – and associated parameters (scale,
oversee the construction and operation of a new network shape, minimum, maximum, etc.), yielding a corresponding
along Australia’s eastern seaboard.
distribution of outputs. Probabilistic emission modeling is
Concerning freight transport, the reference road not new, but it is less common than simpler deterministic
8,12
vehicle was an articulated truck (AT). In the case of rail modeling. Probabilistic analysis offers specific benefits. It is
freight, a reference diesel train was based mainly on data well-suited to understanding uncertainty and variability,
11
for the planned Inland Rail route. This included separate it can accommodate non-linear interactions, and it
10
provides both the possible range of model outputs and their
relative likelihood. It also facilitates the development of
inputs that can otherwise be scarce, of unclear quality, or
contradictory, and it enables the use of expert judgment to
fill gaps, potentially reflecting a broad range of viewpoints.
Probabilistic methods can also be used to identify which
aspects of an analysis are the most uncertain and warrant
further examination (beyond the scope of this study). These
are important considerations when comparing different
mode shift options. The probabilistic approach ultimately
provides decision makers with a range of representative
outcomes and their chance of occurrence, as well as useful
insight into the robustness of study outcomes. It, therefore,
Figure 2. Map (WGS84) of land transport routes between Brisbane and supports the more cost-effective real-world implementation
Melbourne, Australia. Pink line denotes road and yellow line represents of mode shift policies and measures.
rail.
Abbreviations: QLD: Queensland; NSW: New South Wales; VIC: Victoria; Figure 3 illustrates the probabilistic approach employed
BNE: Brisbane; MEL: Melbourne. in this study. The approach started with the formulation
Volume 1 Issue 1 (2024) 4 doi: 10.36922/eer.3470