
Page 63 - EER-2-1
P. 63
Explora: Environment
and Resource Sustainable urban park design
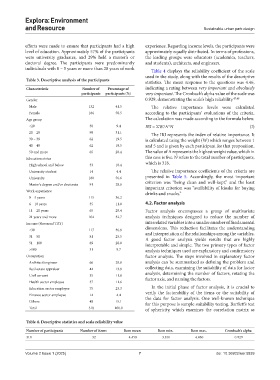
efforts were made to ensure that participants had a high experience. Regarding income levels, the participants were
level of education. Approximately 57% of the participants approximately equally distributed. In terms of professions,
were university graduates, and 29% held a master’s or the leading groups were educators (academics, teachers,
doctoral degree. The participants were predominantly and students), architects, and engineers.
individuals with 0 – 5 years or more than 20 years of work Table 4 displays the reliability coefficient of the scale
used in the study, along with the results of the descriptive
Table 3. Descriptive analysis of the participants statistics. The mean response to the questions was 4.46,
Characteristic Number of Percentage of indicating a rating between very important and absolutely
participants participants (%) very important. The Cronbach’s alpha value of the scale was
Gender 0.929, demonstrating the scale’s high reliability. 47,48
Male 132 41.5 The relative importance levels were calculated
Female 186 58.5 according to the participants’ evaluations of the criteria.
Age group The calculation was made according to the formula below.
<20 30 9.4 IRI = ΣW/A*N (I)
20 – 29 99 31.1 The IRI represents the index of relative importance. It
30 – 39 62 19.5 is calculated using the weight (W) which ranges between 1
40 – 49 62 19.5 and 5 and is given by each participant for that proposition.
50 and more 65 20.4 The value of A represents the highest weight value, which in
Education status this case is five. N refers to the total number of participants,
High school and below 33 10.4 which is 318.
University student 14 4.4 The relative importance coefficients of the criteria are
University 180 56.6 presented in Table 5. Accordingly, the most important
Master’s degree and/or doctorate 91 28.6 criterion was “being clean and well-kept,” and the least
Work experience important criterion was “availability of kiosks for buying
drinks and snacks.”
0 – 5 years 115 36.2
6 – 10 years 35 11.0 4.2. Factor analysis
11 – 20 years 65 20.4 Factor analysis encompasses a group of multivariate
21 years and more 104 32.7 analysis techniques designed to reduce the number of
Income (thousand TRY) interrelated variables into a smaller number of fundamental
<30 117 36.8 dimensions. This reduction facilitates the understanding
31 – 50 81 25.5 and interpretation of the relationships among the variables.
A good factor analysis yields results that are highly
51 – 100 89 28.0 interpretable and simple. The two primary types of factor
>100 31 9.7 analysis techniques used are explanatory and confirmatory
Occupation factor analysis. The steps involved in explanatory factor
Architect/engineer 66 20.8 analysis can be summarized as defining the problem and
Real estate appraiser 44 13.8 collecting data, examining the suitability of data for factor
Civil servant 35 11.0 analysis, determining the number of factors, rotating the
factor axis, and naming the factors.
Health sector employee 37 11.6
Education sector employee 75 23.3 In the initial phase of factor analysis, it is crucial to
Finance sector employee 14 4.4 verify the factorability of the items or the suitability of
the data for factor analysis. One well-known technique
Others 48 15.1
for this purpose is sample suitability testing. Bartlett’s test
Total 318 100.0 of sphericity, which examines the correlation matrix as
Table 4. Descriptive statistics and scale reliability value
Number of participants Number of items Item mean Item min. Item max. Cronbach’s alpha
318 32 4.458 3.810 4.860 0.929
Volume 2 Issue 1 (2025) 7 doi: 10.36922/eer.5839