
Page 64 - EER-2-1
P. 64
Explora: Environment
and Resource Sustainable urban park design
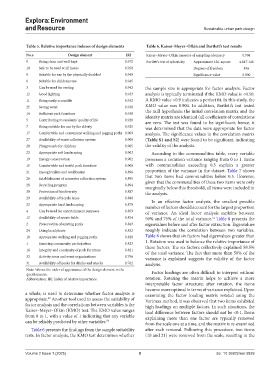
Table 5. Relative importance indexes of design elements Table 6. Kaiser–Meyer–Olkin and Bartlett’s test results
No.a Design element IRI Kaiser–Meyer–Olkin measure of sampling adequacy 0.904
9 Being clean and well-kept 0.972 Bartlett’s test of sphericity Approximate Chi-square 4,847.146
10 Safe to be used at all hours 0.950 Degrees of freedom 496
8 Suitable for use by the physically disabled 0.949 Significance value 0.000
6 Suitable for childrens use 0.945
3 Can be used for resting 0.942 the sample size is appropriate for factor analysis. Factor
12 Good lighting 0.933 analysis is typically terminated if the KMO value is <0.50.
11 Being easily accessible 0.932 A KMO value >0.9 indicates a perfect fit. In this study, the
25 Saving water 0.930 KMO value was 0.904. In addition, Bartlett’s test tested
14 Sufficient park furniture 0.930 the null hypothesis: the initial correlation matrix and the
identity matrix are identical (all coefficients of correlations
5 Contributing to residents’ quality of life 0.928 are zero. The test was found to be significant; hence, it
7 Being suitable for use by the elderly 0.925 was determined that the data were appropriate for factor
17 Comfortable and convenient walking and jogging paths 0.909 analysis. The significance values in the correlation matrix
27 Availability of waste collection system 0.908 (Table S1 and S2) were found to be significant, indicating
20 Playgrounds for children 0.905 the validity of the analysis.
22 Appropriate soft landscaping 0.903 According to the communalities table, every variable
19 Energy conservation 0.902 possesses a common variance ranging from 0 to 1. Items
15 Comfortable and useful park furniture 0.900 with communalities exceeding 0.5 explain a greater
21 Enough toilets and washbasins 0.896 proportion of the variance in the dataset. Table 7 shows
26 Establishment of rainwater collection system 0.895 that two items had communalities below 0.5. However,
given that the communalities of these two items were only
28 Recycling program 0.894 marginally below this threshold, all items were included in
30 Protection of biodiversity 0.887 the analysis.
29 Availability of bicycle lanes 0.880
In an effective factor analysis, the smallest possible
23 Appropriate hard landscaping 0.879 number of factors should account for the largest proportion
4 Can be used for entertainment purposes 0.859 of variance. An ideal factor analysis explains between
13 Availability of sports fields 0.854 50% and 75% of the total variance. Table 8 presents the
51
2 Preservation of existing parks 0.843 eigenvalues before and after factor extraction. Eigenvalues
24 Using local plants 0.832 roughly indicate the correlation between two variables.
18 Appropriate walking and jogging paths 0.828 Table 8 shows that six factors had eigenvalues greater than
1 Ensuring community participation 0.823 1. Rotation was used to balance the relative importance of
16 Integrity and continuity of park furniture 0.821 these factors. The six factors collectively explained 58.5%
of the total variance. The fact that more than 50% of the
32 Activity areas and event organizations 0.796 variance is explained suggests the validity of the factor
31 Availability of kiosks for drinks and snacks 0.762 analysis.
Note: shows the order of appearance of the design element in the Factor loadings are often difficult to interpret without
a
questionnaire.
Abbreviation: IRI: Index of relative importance. rotation. Rotating the matrix helps to achieve a more
interpretable factor structure; after rotation, the items
become more optimal in terms of variance explained. Upon
a whole, is used to determine whether factor analysis is examining the factor loading matrix rotated using the
appropriate. Another tool used to assess the suitability of Varimax method, it was observed that two items exhibited
49
factor analysis and the correlations between variables is the high loadings on multiple factors. In such situations, the
Kaiser–Meyer–Olkin (KMO) test. The KMO value ranges load difference between factors should not be <0.1. Items
from 0 to 1, with a value of 1 indicating that any variable explaining more than one factor are typically removed
can be reliably predicted by other variables. 50 from the scale one at a time, and the matrix is re-examined
Table 6 presents the findings from the sample suitability after each removal. Following this procedure, two items
tests. In factor analysis, the KMO test determines whether (10 and 21) were removed from the scale, resulting in the
Volume 2 Issue 1 (2025) 8 doi: 10.36922/eer.5839