
Page 107 - EER-2-2
P. 107
Explora: Environment
and Resource Climate suitability of AWD practice
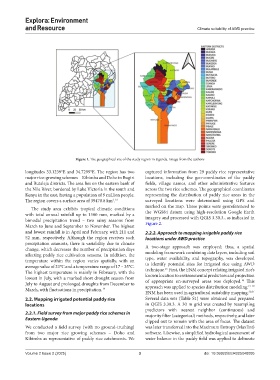
Figure 1. The geographical site of the study region in Uganda. Image from the authors
longitudes 33.1239°E and 34.7299°E. The region has two captured information from 29 paddy rice representative
major rice-growing schemes – Kibimba and Doho in Bugiri locations, including the geo-coordinates of the paddy
and Butaleja districts. The area lies on the eastern bank of fields, village names, and other administrative features
the Nile River, bordered by Lake Victoria in the south and across the two rice schemes. The geographical coordinates
Kenya in the east, having a population of 9 million people. representing the distribution of paddy rice areas in the
The region covers a surface area of 39478.8 km . surveyed locations were determined using GPS and
2 13
The study area exhibits tropical climatic conditions marked on the map. These points were georeferenced to
with total annual rainfall up to 1500 mm, marked by a the WGS84 datum using high-resolution Google Earth
bimodal precipitation trend – two rainy seasons from imagery and processed with QGIS 3.30.3., as indicated in
Figure 2.
March to June and September to November. The highest
and lowest rainfall is in April and February, with 211 and 2.2.2. Approach to mapping irrigable paddy rice
52 mm, respectively. Although the region receives such locations under AWD practice
precipitation amounts, there is variability due to climate
change, which decreases the number of precipitation days A two-stage approach was employed; thus, a spatial
affecting paddy rice cultivation seasons. In addition, the modeling framework combining data layers, including soil
temperature within the region varies spatially, with an type, water availability, and topography, was developed
average value of 23°C and a temperature range of 17 – 35°C. to identify potential sites for irrigated rice using AWD
technique. First, the ENM concept relating irrigated rice’s
15
The highest temperature is mainly in February, with the
lowest in July, with a marked short drought season from known location to environmental predictors and projection
16
July to August and prolonged droughts from December to of appropriate un-surveyed areas was deployed. This
approach was applied to species distribution modeling.
17-19
March, with fluctuations in precipitation. 14
ENM has been used in agricultural suitability mapping. 20,21
2.2. Mapping irrigated potential paddy rice Several data sets (Table S1) were obtained and prepared
locations in QGIS 3.30.3. A 30 m grid was created by resampling
predictors with nearest neighbor (continuous) and
2.2.1. Field survey from major paddy rice schemes in majority filter (categorical) methods, respectively, and later
Eastern Uganda clipped out to remain with the area of focus. The dataset
We conducted a field survey (with no ground-truthing) was later transferred into the Maximum Entropy (MaxEnt)
from two major rice growing schemes – Doho and software. Likewise, a simplified hydrological assessment of
Kibimba as representative of paddy rice catchments. We water balance in the paddy field was applied to delineate
Volume 2 Issue 2 (2025) 3 doi: 10.36922/EER025040005