
Page 108 - EER-2-2
P. 108
Explora: Environment
and Resource Climate suitability of AWD practice
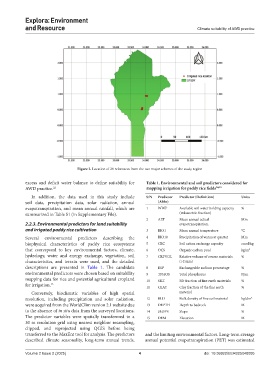
Figure 2. Location of 29 references from the two major schemes of the study region
excess and deficit water balance to define suitability for Table 1. Environmental and soil predictors considered for
AWD practice. 22 mapping irrigation for paddy rice fields 20,25
In addition, the data used in this study include S/N Predictor Predictor (Definition) Units
soil data, precipitation data, solar radiation, annual (Abbr)
evapotranspiration, and mean annual rainfall, which are 1 WWP Available soil water holding capacity %
summarized in Table S1 (in Supplementary File). (volumetric fraction)
2 AET Mean annual actual Mm
2.2.3. Environmental predictors for land suitability evapotranspiration.
and irrigated paddy rice cultivation 3 BIO1 Mean annual temperature °C
Several environmental predictors describing the 4 BIO18 Precipitation of warmest quarter Mm
biophysical characteristics of paddy rice ecosystems 5 CEC Soil cation exchange capacity cmol/kg
that correspond to key environmental factors, climate, 6 OCS Organic carbon pool kg/m 2
hydrology, water and energy exchange, vegetation, soil 7 CRFVOL Relative volume of course materials %
characteristics, and terrain were used, and the detailed (>2 mm)
descriptions are presented in Table 1. The candidate 8 ESP Exchangeable sodium percentage %
environmental predictors were chosen based on suitability 9 TPHOS Total phosphorus Ppm
mapping data for rice and potential agricultural cropland 10 SILT Silt fraction of fine earth materials %
for irrigation. 23 11 CLAY Clay fraction of the fine earth %
Conversely, bioclimatic variables of high spatial material
resolution, including precipitation and solar radiation, 12 BLD Bulk density of fine soil material kg/dm 2
were acquired from the WorldClim version 2.1 website due 13 DEPTH Depth to bedrock M
to the absence of in situ data from the surveyed locations. 14 SLOPE Slope %
The predictor variables were spatially transformed to a 15 DEM Elevation M
30 m resolution grid using nearest neighbor resampling,
clipped, and reprojected using QGIS before being
transferred to the MaxEnt tool for analysis. The predictors and the limiting environmental factors. Long-term average
described climate seasonality, long-term annual trends, annual potential evapotranspiration (PET) was estimated
Volume 2 Issue 2 (2025) 4 doi: 10.36922/EER025040005