
Page 112 - EER-2-2
P. 112
Explora: Environment
and Resource Climate suitability of AWD practice
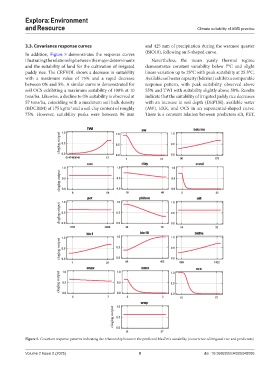
3.3. Covariance response curves and 425 mm of precipitation during the warmest quarter
In addition, Figure 5 demonstrates the response curves (BIO18), following an S-shaped curve.
illustrating the relationship between the major determinants Nevertheless, the mean yearly thermal regime
and the suitability of land for the cultivation of irrigated demonstrates constant variability below 7°C and slight
paddy rice. The CRFVOL shows a decrease in suitability linear variation up to 25°C with peak suitability at 25.5°C.
with a maximum value of 75% and a rapid decrease Available soil water capacity (bdcrim) exhibits a comparable
between 0% and 5%. A similar curve is demonstrated for response pattern, with peak suitability observed above
soil OCS exhibiting a maximum suitability of 100% at 10 55% and TWI with suitability slightly above 50%. Results
tons/ha. Likewise, a decline to 0% suitability is observed at indicate that the suitability of irrigated paddy rice decreases
57 tons/ha, coinciding with a maximum soil bulk density with an increase in soil depth (DEPTH), available water
(BDCRIM) of 175 kg/m and a soil clay content of roughly (AW), EXK, and OCS in an exponential-shaped curve.
3
75%. However, suitability peaks were between 96 mm There is a constant relation between predictors silt, PET,
Figure 5. Covariant response patterns indicating the relationship between the predicted MaxEnt’s suitability (occurrence of irrigated rice and predictors)
Volume 2 Issue 2 (2025) 8 doi: 10.36922/EER025040005