
Page 16 - EER-2-2
P. 16
Explora: Environment
and Resource Trace elements in Mediterranean mussels
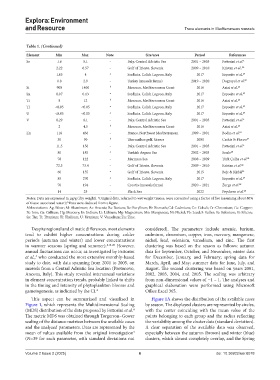
Table 1. (Continued)
Element Min Max Note Site/area Period References
Se 1.6 5.1 - Italy, Central Adriatic Sea 2001 – 2005 Fattorini et al. 4
2.22 6.57 - Gulf of Trieste, Slovenia 2009 – 2010 Kristan et al., 22
1.65 4 a Sardinia, Calich Lagoon, Italy 2017 Esposito et al. 25
0.8 2.9 - Turkey (mussels farms) 2019 – 2020 Dogruyol et al. 27
Si 900 1400 b Morocco, Mediterranean Coast 2016 Azizi et al. 24
Sn 0.07 0.13 a Sardinia, Calich Lagoon, Italy 2017 Esposito et al. 25
Ti 8 12 b Morocco, Mediterranean Coast 2016 Azizi et al. 24
Tl <0.05 <0.05 a Sardinia, Calich Lagoon, Italy 2017 Esposito et al. 25
U <0.05 <0.05 a Sardinia, Calich Lagoon, Italy 2017 Esposito et al. 25
V 0.29 8.1 - Italy, Central Adriatic Sea 2001 – 2005 Fattorini et al. 4
2 4.5 b Morocco, Mediterranean Coast 2016 Azizi et al. 24
Zn 116 436 - France, Northwest Mediterranean 1999 – 2001 Bodin et al. 18
30 90 b Thermaikos gulf, Greece 2000 Caskie & Florou 19
11.5 156 - Italy, Central Adriatic Sea 2001 – 2005 Fattorini et al. 4
80 185 a Turkish Aegean Sea 2002 – 2003 Sunlu 20
78 122 - Marmara Sea 2008 – 2009 Türk Çulha et al. 21
72.3 73.4 - Gulf of Trieste, Slovenia 2009 – 2010 Kristan et al. 22
60 155 a Gulf of Trieste, Slovenia 2015 Bajc & Kirbiš 23
85 270 a Sardinia, Calich Lagoon, Italy 2017 Esposito et al. 25
76 194 - Croatia (mussels farms) 2020 – 2021 Žurga et al. 28
14 25 - Black Sea 2022 Peycheva et al. 26
Notes: Data are expressed in µg/g (dry weight). Original data, referred to wet weight tissues, were converted using a factor of five (assuming about 80%
a
of tissue-associated water); Data were deduced from a figure.
b
Abbreviations: Ag: Silver; Al: Aluminum; As: Arsenic; Ba: Barium; Be: Beryllium; Bi: Bismuth; Cd: Cadmium; Co: Cobalt; Cr: Chromium; Cu: Copper;
Fe: Iron; Ga: Gallium; Hg: Mercury; In: Indium; Li: Lithium; Mg: Magnesium; Mn: Manganese; Ni: Nickel; Pb: Lead; S: Sulfur; Se: Selenium; Si: Silicon;
Sn: Tin; Ti: Titanium; Tl: Thallium; U: Uranium; V: Vanadium; Zn: Zinc.
Despite regional and climatic differences, most elements considered). The parameters include arsenic, barium,
tend to exhibit higher concentrations during colder cadmium, chromium, copper, iron, mercury, manganese,
periods (autumn and winter) and lower concentrations nickel, lead, selenium, vanadium, and zinc. The first
in warmer seasons (spring and summer). 4,18-28 However, clustering was based on the season as follows: autumn
annual fluctuations can occur, as investigated by Fattorini data for September, October, and November; winter data
et al., who conducted the most extensive monthly-based for December, January, and February; spring data for
4
study to date, with data spanning from 2001 to 2005, on March, April, and May; summer data for June, July, and
mussels from a Central Adriatic Sea location (Protonovo, August. The second clustering was based on years 2001,
Ancona, Italy). This study revealed interannual variations 2002, 2003, 2004, and 2005. The scaling was arbitrary
in element concentration trends, probably linked to shifts from non-dimensional values of −1 – 1. The analyses and
in the timing and intensity of phytoplankton blooms and graphical elaboration were performed using Microsoft
gametogenesis, as indicated by the CI. 4 Office Excel 365.
This aspect can be summarized and visualized in Figure 1A shows the distribution of the available cases
Figure 1, which represents the Multidimensional Scaling by season. The displayed clusters are represented by circles,
(MDS) distribution of the data proposed by Fattorini et al. with the center coinciding with the mean value of the
4
The metric MDS was obtained through Torgerson–Gower points belonging to each group and the radius reflecting
scaling of the distance matrices between the available cases the variability among the cluster data (standard deviation).
and the analyzed parameters. Data are represented by the A clear separation of the available data was observed,
mean of values available from the original investigation especially between the autumn (brown) and winter (blue)
4
(N=39 for each parameter, with standard deviations not clusters, which almost completely overlap, and the Spring
Volume 2 Issue 2 (2025) 6 doi: 10.36922/eer.8078