
Page 94 - EER-2-2
P. 94
Explora: Environment
and Resource Assessing ecosystems by land cover and landscapes
A B C
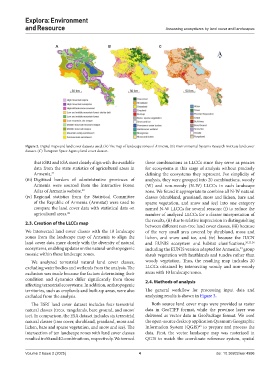
Figure 2. Digital maps and land cover datasets used. (A) The map of landscape zones of Armenia. (B) Environmental Systems Research Institute land cover
dataset. (C) European Space Agency land cover dataset.
that ESRI and ESA most closely align with the available these combinations as LLCCs since they serve as proxies
data from the state statistics of agricultural areas in for ecosystems at this stage of analysis without precisely
Armenia. 41 defining the ecosystems they represent. For simplicity of
(iii) Digitized borders of administrative provinces of analysis, they were grouped into 20 combinations, woody
Armenia were sourced from the Interactive Forest (W) and non-woody (N-W) LLCCs in each landscape
Atlas of Armenia website. 40 zone. We found it appropriate to combine all N-W natural
(iv) Regional statistics from the Statistical Committee classes (shrubland, grassland, moss and lichen, bare and
of the Republic of Armenia (Armstat) were used to sparse vegetation, and snow and ice) into one category
compare the land cover data with statistical data on named N-W LLCCs for several reasons: (i) to reduce the
agricultural areas. 42 number of analyzed LLCCs for a clearer interpretation of
the results, (ii) due to relative imprecision in distinguishing
2.3. Creation of the LLCCs map
between different non-tree land cover classes, (iii) because
We intersected land cover classes with the 10 landscape of the very small area covered by shrubland, moss and
zones from the landscape map of Armenia to align the lichen, and snow and ice, and (iv) because the IUCN
land cover data more closely with the diversity of natural and EUNIS ecosystem and habitat classifications, 20,22,26
ecosystems, enabling updates on the natural-anthropogenic including the EUNIS version adapted for Armenia, group
34
mosaic within these landscape zones. shrub vegetation with heathlands and tundra rather than
We analyzed terrestrial natural land cover classes, woody vegetation. Thus, the resulting map includes 20
excluding water bodies and wetlands from the analysis. The LLCCs obtained by intersecting woody and non-woody
exclusion was made because the factors determining their areas with 10 landscape zones.
condition and dynamics differ significantly from those 2.4. Methods of analysis
affecting terrestrial ecosystems. In addition, anthropogenic
territories, such as croplands and built-up areas, were also The general workflow for processing input data and
excluded from the analysis. analyzing results is shown in Figure 3.
The ESRI land cover dataset includes four terrestrial Both source land cover maps were provided as raster
natural classes (trees, rangelands, bare ground, and snow/ data in GeoTIFF format, while the province layer was
ice). In comparison, the ESA dataset includes six terrestrial delivered as vector data in GeoPackage format. We used
natural classes (tree cover, shrubland, grassland, moss and the open-source desktop application Quantum Geographic
43
lichen, bare and sparse vegetation, and snow and ice). The Information System (QGIS) to prepare and process the
intersection of ten landscape zones with land cover classes data. First, the vector landscape map was rasterized in
resulted in 60 and 40 combinations, respectively. We termed QGIS to match the coordinate reference system, spatial
Volume 2 Issue 2 (2025) 4 doi: 10.36922/eer.4996