
Page 95 - EER-2-2
P. 95
Explora: Environment
and Resource Assessing ecosystems by land cover and landscapes
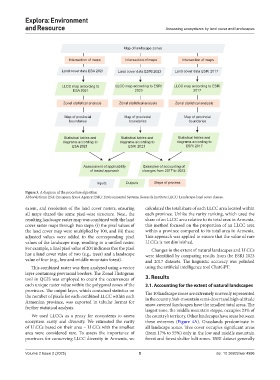
Map of landscape zones
Intersection of maps Intersection of maps Intersection of maps
Land cover data ESA 2021 Land cover data ESRI 2023 Land cover data ESRI 2017
LLCC map according to LLCC map according to ESRI LLCC map according to ESRI
ESA 2021 2023 2017
Zonal statistical analysis Zonal statistical analysis Zonal statistical analysis
Map of provincial Map of provincial Map of provincial
boundaries boundaries boundaries
Statistical tables and Statistical tables and Statistical tables and
diagrams according to diagrams according to diagrams according to
ESA 2021 ESRI 2023 ESRI 2017
Assessment of applicability Examples of accounting of
of tested approach changes from 2017 to 2023
Inputs Outputs Steps of process
Figure 3. A diagram of the procedure algorithm
Abbreviations: ESA: European Space Agency; ESRI: Environmental Systems Research Institute; LLCC: Landscape-land cover classes.
extent, and resolution of the land cover rasters, ensuring calculated the total share of each LLCC area located within
all maps shared the same pixel-wise structure. Next, the each province. Unlike the rarity ranking, which used the
resulting landscape raster map was combined with the land share of an LLCC area relative to its total area in Armenia,
cover raster maps through two steps: (i) the pixel values of this method focused on the proportion of an LLCC area
the land cover map were multiplied by 100, and (ii) these within a province compared to its total area in Armenia.
adjusted values were added to the corresponding pixel This approach was applied to ensure that the value of rare
values of the landscape map, resulting in a unified raster. LLCCs is not diminished.
For example, a final pixel value of 204 indicates that the pixel Changes in the extent of natural landscapes and LLCCs
has a land cover value of two (e.g., trees) and a landscape were identified by comparing results from the ESRI 2023
value of four (e.g., low and middle mountain forest). and 2017 datasets. The linguistic accuracy was polished
This combined raster was then analyzed using a vector using the artificial intelligence tool ChatGPT.
layer containing provincial borders. The Zonal Histogram
tool in QGIS was employed to count the occurrences of 3. Results
each unique raster value within the polygonal zones of the 3.1. Accounting for the extent of natural landscapes
provinces. The output layer, which contained statistics on The 10 landscape zones are extremely unevenly represented
the number of pixels for each combined LLCC within each in the country. Sub-mountain semi-desert and high-altitude
Armenian province, was exported in tabular format for snow-covered landscapes have the smallest total areas. The
further statistical analysis.
largest zone, the middle mountain steppe, occupies 23% of
We used LLCCs as a proxy for ecosystems to assess the country’s territory. Other landscapes have areas between
ecosystem rarity and diversity. We estimated the rarity these extremes (Figure 4A). Grasslands predominate in
of LLCCs based on their area – LLCCs with the smallest all landscape zones. Tree cover occupies significant areas
area were considered rare. To assess the importance of (from 17% to 55%) only in the low and middle mountain
provinces for conserving LLCC diversity in Armenia, we forest and forest shelter belt zones. ESRI dataset generally
Volume 2 Issue 2 (2025) 5 doi: 10.36922/eer.4996