
Page 186 - EJMO-9-1
P. 186
Eurasian Journal of Medicine and
Oncology
Research on hypoxia and ECM in cancer
A
B
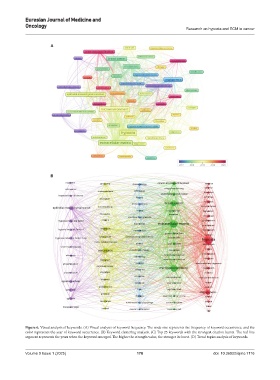
Figure 6. Visual analysis of keywords. (A) Visual analysis of keyword frequency. The node size represents the frequency of keyword occurrence, and the
color represents the year of keyword occurrence. (B) Keyword clustering analysis. (C) Top 25 keywords with the strongest citation bursts. The red line
segment represents the years when the keyword emerged. The higher the strength value, the stronger its burst. (D) Trend topics analysis of keywords.
Volume 9 Issue 1 (2025) 178 doi: 10.36922/ejmo.7116