
Page 183 - EJMO-9-1
P. 183
Eurasian Journal of Medicine and
Oncology
Research on hypoxia and ECM in cancer
A
B
C
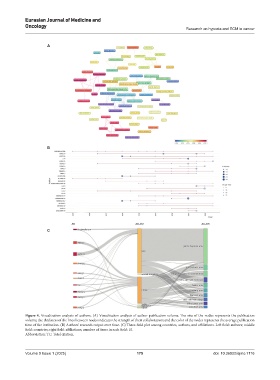
Figure 4. Visualization analysis of authors. (A) Visualization analysis of author publication volume. The size of the nodes represents the publication
volume; the thickness of the lines between nodes indicates the strength of their collaboration; and the color of the nodes represents the average publication
time of the institution. (B) Authors’ research output over time. (C) Three-field plot among countries, authors, and affiliations. Left field: authors; middle
field: countries; right field: affiliations; number of items in each field: 10.
Abbreviation: TC: Total citation.
Volume 9 Issue 1 (2025) 175 doi: 10.36922/ejmo.7116