
Page 180 - EJMO-9-1
P. 180
Eurasian Journal of Medicine and
Oncology
Research on hypoxia and ECM in cancer
proportion of multiple-country publications, reflecting followed by Wang Y. (six publications) and Wirtz D.
their extensive international collaborations in this field. (six publications). The top 10 authors collectively
Although China has the highest publication volume, its contributed 56 papers, representing 15.95% of the total
level of international collaboration is comparatively lower. publications. Wirtz D. is the most cited author with
The betweenness centrality of a country or region 1686 total citations and 99 local citations, followed by
is an indicator of its importance within the research Semenza G.L. (1682 citations; 98 local citations) and
network. Figure S2 highlights countries/regions with Gilkes D.M. (1682 citations; 98 local citations). In terms
high betweenness centrality, with the USA in a dominant of h-index, Bhujwalla Z.M. has the highest scores of
position, followed by the United Kingdom and Portugal. 8 separately, followed by Wang Y. (h-index = 5) and Yang
Despite China’s high publication volume, it lags significantly J. (h-index = 5). The m-index, calculated by dividing the
behind the USA in terms of citation count, international h-index by the number of years since the scientist’s first
collaboration ratio, and betweenness centrality. This publication, is used to further evaluate author performance
disparity may be attributed to China’s relatively late start and account for differences in career length. Mortezaee K.
in this field as a developing country, resulting in less depth has the highest m-index at 0.667, followed by Bhujwalla Z.M.
and maturity in its research. (0.444), Gilkes D.M. (0.333), and Semenza G.L. (0.333).
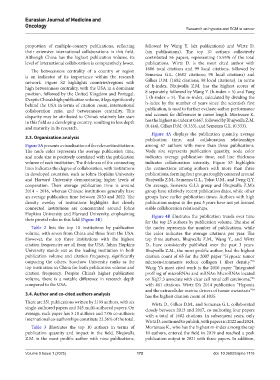
Figure 4A displays the publication quantity, average
3.3. Organization analysis publication time, and collaboration relationships
Figure 3A presents a visualization of the relevant institutions. among 67 authors with more than three publications.
The node color represents the average publication time, Node size represents publication quantity, node color
and node size is positively correlated with the publication indicates average publication time, and line thickness
volume of each institution. The thickness of the connecting indicates collaboration intensity. Figure S3 highlights
lines indicates the degree of collaboration, with institutions the connections among authors with more than three
in developed countries, such as Johns Hopkins University publications, forming four groups roughly centered around
and Harvard University demonstrating higher levels of Bhujwalla Z.M., Semenza G.L., Tokat U.M., and Deng Q.Y.
cooperation. Their average publication time is around On average, Semenza G.L.’s group and Bhujwalla Z.M.’s
2014 – 2016, whereas Chinese institutions generally have group have relatively recent publication dates, while other
an average publication time between 2020 and 2022. The groups have earlier publication times. Authors with high
density overlay of institutions highlights that closely publication output in the past 5 years have not yet formed
connected institutions are concentrated around Johns stable collaboration relationships.
Hopkins University and Harvard University, emphasizing Figure 4B illustrates the publication trends over time
their pivotal roles in this field (Figure 3B). for the top 25 authors by publication volume. The size of
Table 2 lists the top 10 institutions by publication the nodes represents the number of publications, while
volume, with seven from China and three from the USA. the color indicates the average citations per year. The
However, the top three institutions with the highest top three authors, Bhujwalla Z.M., Wang Y., and Wirtz
citation frequencies are all from the USA. Johns Hopkins D., have consistently published over the past 3 years.
University stands out as the leading institution in both Bhujwalla Z.M., the most prolific author, had the highest
publication volume and citation frequency, significantly citation count of 65 for the 2007 paper “Hypoxic tumor
outpacing the others. Soochow University ranks as the microenvironments reduce collagen I fiber density.”
36
top institution in China for both publication volume and Wang Y.’s most cited work is the 2010 paper “Integrated
citation frequency. Despite China’s higher publication profiling of microRNAs and mRNAs: MicroRNAs located
volume, there is a notable difference in research depth on Xq27.3 associate with clear cell renal cell carcinoma,”
35
compared to the USA. with 461 citations. Wirtz D.’s 2014 publication “Hypoxia
and the extracellular matrix: drivers of tumor metastasis”
14
3.4. Author and co-cited authors analysis has the highest citation count of 1035.
There are 351 publications written by 2199 authors, with six Wirtz D., Gilkes D.M., and Semenza G.L. collaborated
single-authored papers and 345 multi-authored papers. On closely between 2013 and 2017, co-authoring four papers
average, each paper has 5.18 authors and 7.06 co-authors; with a total of 1682 citations. In subsequent years, only
international co-authorships constitute 23.36% of the total. Wirtz D. continued to publish, with papers in 2022 and 2024.
Table 3 illustrates the top 10 authors in terms of Mortezaee K., who has the highest m-index among the top
publication quantity and impact in the field. Bhujwalla 10 authors, entered the field in 2019 and reached a peak
Z.M. is the most prolific author with nine publications, publication output in 2021 with three papers. In addition,
Volume 9 Issue 1 (2025) 172 doi: 10.36922/ejmo.7116