
Page 181 - EJMO-9-1
P. 181
Eurasian Journal of Medicine and
Oncology
Research on hypoxia and ECM in cancer
A
B
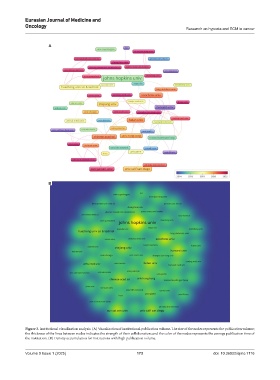
Figure 3. Institutional visualization analysis. (A) Visualization of institutional publication volume. The size of the nodes represents the publication volume;
the thickness of the lines between nodes indicates the strength of their collaboration; and the color of the nodes represents the average publication time of
the institution. (B) Density accumulation for institutions with high publication volume.
Volume 9 Issue 1 (2025) 173 doi: 10.36922/ejmo.7116