
Page 257 - EJMO-9-1
P. 257
Eurasian Journal of
Medicine and Oncology Quality of life, somatosensory amplification, and stress in ADPKD
and was developed by Barsky et al. Each question is respect to categorical variables. Pearson’s correlation test
32
scored between 1 and 5. The total score is considered the was used for variables that were normally distributed. In
amplification score. A Turkish validity and reliability study addition, a regression model and binary logistic regression
was carried out by Güleç and Sayar. The Turkish version of analysis were performed. A p-value of 0.05 denotes
33
the SSAS has demonstrated acceptable internal consistency, statistical significance.
with Cronbach’s alpha values ranging from 0.62 to 0.76. In
addition, the test-retest reliability coefficient was reported 2.6. Ethical consideration
as 0.73, further supporting the scale’s consistency over This study obtained ethical approval from the University
time. The Cronbach’s alpha of this study was 0.64, which Ethic Committee (approval number: 29533901-050.99-
33
is acceptable for reliability and validity. 14210/2022) and Helsinki Declaration guidelines were
followed during the study. Informed consent was obtained
2.4. The Perceived Stress Scale (PSS) from all participants.
The PSS-10, which was validated and translated into
Turkish by Eskin et al., was used to assess stress levels. 3. Results
34
The Turkish version was also found to have adequate The average age of patients with PKD (n = 48) was 34.12 ±
reliability and validity to measure stress level. The PSS-10 7.27 years and that of the healthy group (n = 50) was 33.74
deals with feelings and thoughts that participants reflect on ± 6.34 years. There was no statistically significant difference
their current life situations. It is a Likert scale to measure between the two groups in terms of age, total education
stress levels (0 = Never, 1 = Almost never, 2 = Sometimes, time, and total working time (p > 0.05), but there was a
3 = Fairly often, and 4 = Very often). The higher the statistically significant difference in gender (p = 0.000)
score, the higher the level of stress. The scale correlates (Table 1). The average HRQOL score for the ADPKD group
with depression and perception of poorer health. The was 14.83 ± 8.73, whereas that for the healthy group was
Cronbach’s alpha coefficient for the PSS generally ranges 20.16 ± 8.46, and the difference between the two group was
from 0.70 to 0.90. The Cronbach’s alpha coefficient for this statistically significant (t = 3.342, p = 0.012). The average
study was determined as 0.75. PSS score of the PKD group was 26.82 ± 15.32 and that
of healthy group was 12.45 ± 6.12, which were statistically
2.5. Statistical analysis different from each other (t = 4.214, p < 0.001). The average
Statistical analysis was performed using the Statistical SSAS score of the PKD group was 32.30 ± 8.64, which was
Package for the Social Sciences 25.0 (IBM Inc., Chicago, IL, significantly higher than the score of 20.29 ± 9.36 in the
USA). The mean and standard deviation were calculated healthy group (t = 5.664, p < 0.001). The total education
for each group as a descriptive analysis. The Kolmogorov– time for the PKD group was 12.28 ± 4.94, whereas that
Smirnov test was used to test for normality. The Student’s of the healthy group was 16.44 ± 8.52, and the difference
t-test was performed to compare the mean of the groups. between these scores was not statistically significant
The Chi-square test was used to compare groups with (U = 918.6, p = 0.463). The total working time for the PKD
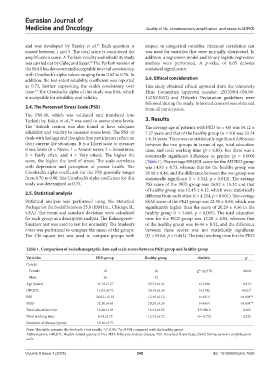
Table 1. Comparison of sociodemographic data and scale scores between PKD group and healthy group
Variables PKD group Healthy group Statistic p
Gender
Female 12 18 χ =12.378 0.000
2
Male 36 32
Age (years) 34.12±7.27 33.74±6.34 t=1408 0.213
HRQOL 14.83±8.73 20.16±8.46 t=3342 0.012*
PSS 26.82±15.32 12.45±6.12 t=4214 <0.001**
SSAS 32.30±8.64 20.29±9.36 t=5664 <0.001**
Total education time 12.28±4.94 16.44±8.52 U=918.6 0.463
Total working time 8.44±5.73 12.33±6.72 t=−0.772 0.226
Duration of disease (years) 12.46±5.77
Note: This table presents the Student’s t-test results. *P<0.05; **p<0.001 compared with the healthy group.
Abbreviations: HRQOL: Health-related quality of life; PKD: Polycystic kidney disease; PSS: Perceived Stress Scale, SSAS: Somatosensory amplification
scale.
Volume 9 Issue 1 (2025) 249 doi: 10.36922/ejmo.7550