
Page 196 - EJMO-9-3
P. 196
Eurasian Journal of
Medicine and Oncology Medication therapy based on HbA1c
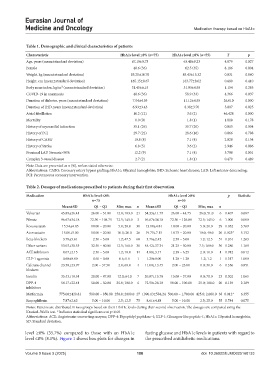
Table 1. Demographic and clinical characteristics of patients
Characteristic HbA1c level ≤8% (n=75) HbA1c level ≥8% (n=55) T p
Age, years (mean±standard deviation) 67.19±9.73 63.48±9.23 4.879 0.027
Female 48.6 (36) 62.5 (35) 8.186 0.004
Weight, kg (mean±standard deviation) 85.20±16.76 85.43±15.32 0.031 0.860
Height, cm (mean±standard deviation) 165.15±8.67 163.77±8.02 0.680 0.410
Body mass index, kg/m² (mean±standard deviation) 31.45±6.15 31.93±4.58 1.154 0.283
COVID-19 in anamnesis 48.6 (36) 58.9 (33) 4.366 0.037
Duration of diabetes, years (mean±standard deviation) 7.04±4.93 11.12±4.55 26.010 0.000
Duration of IHD, years (mean±standard deviation) 6.93±3.43 8.38±3.70 5.007 0.025
Atrial fibrillation 16.2 (12) 3.6 (2) 46.428 0.000
Mortality 0.0 (0) 1.8 (1) 1.818 0.178
History of myocardial infarction 35.1 (26) 35.7 (20) 0.015 0.904
History of PCI 29.7 (22) 28.6 (16) 0.066 0.798
History of CABG 10.8 (8) 7.1 (4) 2.028 0.154
History of Stroke 6.8 (5) 3.6 (2) 2.946 0.086
Proximal LAD Stenosis>50% 12.2 (9) 7.1 (4) 3.798 0.051
Complex 3-vessel disease 2.7 (2) 1.8 (1) 0.479 0.489
Note: Data are presented as n (%), unless stated otherwise.
Abbreviations: CABG: Coronary artery bypass grafting; HbA1c: Glycated hemoglobin; IHD: Ischemic heart disease; LAD: Left anterior descending;
PCI: Percutaneous coronary intervention.
Table 2. Dosages of medications prescribed to patients during their first observation
Medication HbA1c level ≤8% HbA1c level ≥8% p Statistic
n=75 n=55
Mean±SD Q1 – Q3 Min; max n Mean±SD Q1 – Q3 Min; max n
Valsartan 45.89±26.41 26.00 – 51.00 12.8; 103.0 21 34.33±11.79 26.00 – 44.75 26.0; 51.0 6 0.407 0.687
Fibrate 96.67±34.18 72.50 – 108.75 72.5; 145.0 3 96.67±34.18 72.50 – 126.88 72.5; 145.0 6 1.000 0.000
Rosuvastatin 15.54±4.85 10.00 – 20.00 5.0; 20.0 30 13.10±4.81 10.00 – 20.00 5.0; 20.0 29 0.052 3.769
Atorvastatin 15.00±5.00 10.00 – 20.00 10.0; 20.0 26 19.75±7.15 18.75 – 20.00 10.0; 40.0 20 0.023* 5.152
Beta-blockers 3.78±5.61 2.50 – 5.00 1.2; 47.5 68 3.76±2.42 2.50 – 5.00 1.2; 12.5 51 0.261 1.263
Other sartans 53.03±30.55 32.50 – 80.00 12.5; 160.0 30 48.42±37.34 21.25 – 50.00 7.5; 160.0 30 0.280 1.169
ACE inhibitors 4.07±2.15 2.50 – 5.00 1.2; 10.0 14 4.88±3.17 2.38 – 6.25 2.0; 10.0 4 0.912 0.012
GLP-1 agonists 0.60±0.00 0.60 – 0.60 0.6; 0.6 1 1.20±0.00 1.20 – 1.20 1.2; 1.2 1 0.317 1.000
Calcium channel 23.50±23.97 2.00 – 37.50 2.0; 60.0 4 11.00±13.45 2.00 – 23.00 0.0; 30.0 6 0.356 0.851
blockers
Insulin 35.43±18.54 20.00 – 47.00 12.0; 64.0 7 26.87±15.78 15.00 – 37.00 8.0; 70.0 23 0.302 1.065
DPP-4 54.17±22.44 50.00 – 50.00 25.0; 100.0 6 72.50±26.10 50.00 – 100.00 25.0; 100.0 20 0.139 2.189
inhibitors
Metformin 775.00±420.81 500.00 – 850.00 250.0; 2000.0 27 1090.13±584.24 500.00 – 1,700.00 425.0; 2,000.0 38 0.012* 6.355
Empagliflozin 7.87±2.62 5.00 – 10.00 2.5; 12.5 75 8.61±4.88 5.00 – 10.00 2.5; 25.0 55 0.784 0.075
Notes: Patients are distributed in two groups based on their HbA1c levels during their second observation. The dosages are compared using the
Kruskal–Wallis test. *Indicates statistical significance at p˂0.05.
Abbreviations: ACE: Angiotensin-converting enzyme; DPP-4: Dipeptidyl peptidase-4; GLP-1: Glucagon-like peptide-1; HbA1c: Glycated hemoglobin;
SD: Standard deviation.
level ≥8% (35.7%) compared to those with an HbA1c fasting glucose and HbA1c levels in patients with regard to
level ≤8% (8.1%). Figure 1 shows box plots for changes in the prescribed antidiabetic medications.
Volume 9 Issue 3 (2025) 188 doi: 10.36922/EJMO025160133