
Page 200 - EJMO-9-3
P. 200
Eurasian Journal of
Medicine and Oncology Medication therapy based on HbA1c
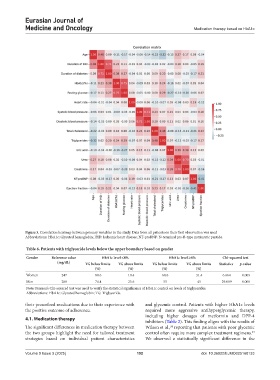
Figure 3. Correlation heatmap between primary variables in the study. Data from all patients on their first observation was used
Abbreviations: HbA1c: Glycated hemoglobin; IHD: Ischemic heart disease; NT-proBNP: N-terminal pro-B-type natriuretic peptide.
Table 6. Patients with triglyceride levels below the upper boundary based on gender
Gender Reference value HbA1c level ≤8% HbA1c level ≥8% Chi‑squared test
(mg/dL) TG below limits TG above limits TG below limits TG above limits Statistics p‑value
(%) (%) (%) (%)
Women 247 80.6 19.4 68.6 31.4 6.664 0.009
Men 288 74.4 25.6 55 45 29.009 0.000
Note: Pearson’s Chi-squared test was used to verify the statistical significance of HbA1c control on levels of triglycerides.
Abbreviations: HbA1c: Glycated hemoglobin; TG: Triglyceride.
their prescribed medications due to their experience with and glycemic control. Patients with higher HbA1c levels
the positive outcome of adherence. required more aggressive antihyperglycemic therapy,
including higher dosages of metformin and DPP-4
4.1. Medication therapy
inhibitors (Table 2). This finding aligns with the results of
The significant differences in medication therapy between Wilson et al., reporting that patients with poor glycemic
24
the two groups highlight the need for tailored treatment control often require more complex treatment regimens.
24
strategies based on individual patient characteristics We observed a statistically significant difference in the
Volume 9 Issue 3 (2025) 192 doi: 10.36922/EJMO025160133