
Page 201 - EJMO-9-3
P. 201
Eurasian Journal of
Medicine and Oncology Medication therapy based on HbA1c
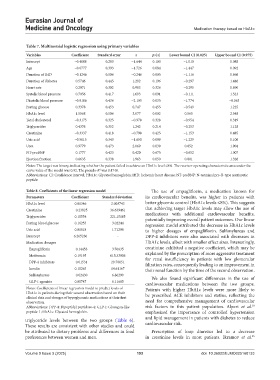
Table 7. Multinomial logistic regression using primary variables
Variables Coefficient Standard error z p>|z| Lower bound CI (0.025) Upper bound CI (0.975)
Intercept −0.4608 0.280 −1.644 0.100 −1.010 0.088
Age −0.6777 0.393 −1.726 0.084 −1.447 0.092
Duration of IHD −0.1246 0.506 −0.246 0.805 −1.116 0.866
Duration of diabetes 0.5746 0.445 1.292 0.196 −0.297 1.446
Heart rate 0.2971 0.302 0.983 0.326 −0.295 0.890
Systolic blood pressure 0.7056 0.417 1.693 0.091 −0.111 1.523
Diastolic blood pressure −0.9186 0.436 −2.105 0.035 −1.774 −0.063
Fasting glucose 0.3378 0.453 0.747 0.455 −0.549 1.225
HbA1c level 1.5568 0.506 3.077 0.002 0.565 2.548
Total cholesterol −0.3175 0.325 −0.978 0.328 −0.954 0.319
Triglycerides 0.4376 0.352 1.242 0.214 −0.253 1.128
Creatinine −0.3337 0.418 −0.798 0.425 −1.153 0.485
Uric acid −0.5615 0.340 −1.650 0.099 −1.229 0.106
Urea 0.9779 0.473 2.069 0.039 0.052 1.904
NT-proBNP 0.1777 0.423 0.420 0.675 −0.652 1.007
Ejection fraction 0.6635 0.338 1.963 0.050 0.001 1.326
Notes: The target was binary, indicating whether the patient failed to achieve an HbA1c level ≤8%. The receiver operating characteristic area under the
2
curve value of the model was 0.92. The pseudo-R was 0.4748.
Abbreviations: CI: Confidence interval; HbA1c: Glycated hemoglobin; IHD: Ischemic heart disease; NT-proBNP: N-terminal pro-B-type natriuretic
peptide.
Table 8. Coefficients of the linear regression model The use of empagliflozin, a medication known for
Parameters Coefficient Standard deviation its cardiovascular benefits, was higher in patients with
HbA1c level 0.81346 2.003743 better glycemic control (HbA1c levels ≤8%). This suggests
Creatinine −0.23825 36.639461 that achieving target HbA1c levels may allow the use of
Triglycerides 0.10554 221.15185 medications with additional cardiovascular benefits,
potentially improving overall patient outcomes. Our linear
Fasting blood glucose 0.16253 3.02244 regression model attributed the decrease in HbA1c levels
Uric acid 0.01018 1.71296 to higher dosages of empagliflozin. Sulfonylureas and
Intercept 6.265236 - DPP-4 inhibitors were also associated with decreases in
Medication dosages HbA1c levels, albeit with smaller effect sizes. Interestingly,
Empagliflozin −0.14453 3.76635 creatinine exhibited a negative coefficient, which may be
Metformin 0.19195 615.33906 explained by the prescription of more aggressive treatment
for renal insufficiency in patients with low glomerular
DPP-4 inhibitors −0.01531 29.76051 filtration rates, consequently leading to an improvement in
Insulin 0.10263 14.61167 their renal function by the time of the second observation.
Sulfonylureas −0.02430 6.86299 We also found significant differences in the use of
GLP-1 agonists 0.00747 0.11685 cardiovascular medications between the two groups.
Notes: Coefficients of linear regression model to predict levels of Patients with higher HbA1c levels were more likely to
HbA1c in patients during their second observation based on their be prescribed ACE inhibitors and statins, reflecting the
clinical data and dosages of hypoglycemic medications at their first
observation. need for comprehensive management of cardiovascular
10
Abbreviations: DPP-4: Dipeptidyl peptidase-4; GLP-1: Glucagon-like risk factors in this patient population. Alpert et al.
peptide-1; HbA1c: Glycated hemoglobin. emphasized the importance of controlled hypertension
triglyceride levels between the two groups (Table 6). and lipid management in patients with diabetes to reduce
These results are consistent with other studies and could cardiovascular risk.
be attributed to dietary problems and differences in food Prescription of loop diuretics led to a decrease
preferences between women and men. in creatinine levels in most patients. Ikramov et al.
25
Volume 9 Issue 3 (2025) 193 doi: 10.36922/EJMO025160133