
Page 197 - EJMO-9-3
P. 197
Eurasian Journal of
Medicine and Oncology Medication therapy based on HbA1c
3.2. Cardiovascular medications ≤8% group (75.7%, t = 12.783, p=0.000). Table 6 shows the
We also analyzed the use of cardiovascular medications results of this treatment on triglyceride levels, analyzed by
among the patients. ACE inhibitors were prescribed to gender across the two groups.
18.9% of patients with an HbA1c level ≤8%, compared to 3.3. Multinomial logistic regression and correlation
7.1% in the HbA1c level ≥8% group (t = 20.908, p=0.000). of variables
Beta-blockers and loop diuretics were commonly used
in both groups, with significant differences in their Figure 3 demonstrates the cross-correlation between the study
usage. Table 4 presents the distribution of cardiovascular variables. The correlation between the durations of T2DM
medication prescriptions across patient groups, expressed and IHD may be attributed to the simultaneous diagnosis
as percentages. of both conditions upon symptom presentation, resulting
in the uncertainty of the actual duration of each disease.
Figure 2 shows the box plots illustrating the changes Understanding these durations is crucial for evaluating
in urea, uric acid, and creatinine levels between the the course of treatment. Apart from the clear correlations
two observations, depending on the type of diuretics between systolic and diastolic blood pressure, fasting glucose
prescribed. We also calculated mean values and SDs for and HbA1c levels, and creatinine, uric acid, and urea levels,
changes in critical clinical parameters according to the other variables exhibited sufficient independence.
prescribed medications. Results are presented in Table 5.
We used the Statsmodels library (v.0.15) to train
The use of statins was significantly higher in the HbA1c a multinomial logistic regression model. To enable
level ≥8% group (87.5%) compared to the HbA1c level interpretation of model coefficients as predictors of variable
importance, we normalized all values before training and
Table 3. Antihyperglycemic medications used in the study testing. The results are shown in Table 7. As anticipated,
groups HbA1c levels during the first observation emerged as the
Medication HbA1c level ≤8% (%) HbA1c level ≥8% (%) most significant predictor. Although N-terminal pro-B-type
Metformin 35.1 69.6 natriuretic peptide (NT-proBNP) had a relatively small
coefficient, its values varied significantly in the sample,
DPP-4 inhibitors 8.1 35.7 even after normalization. Specifically, the maximum value
Sulfonylureas 5.4 8.9 of NT-proBNP reached 6.2, approximately 1.3 times higher
GLP-1 agonists 1.4 1.8 than the maximum value of all other markers, explaining
Insulin 9.5 41.1 the disproportionately small coefficient. Other key
Abbreviations: DPP-4: Dipeptidyl peptidase-4; GLP-1: Glucagon-like predictors included urea levels, diastolic blood pressure,
peptide-1; HbA1c: Glycated hemoglobin. and duration of diabetes.
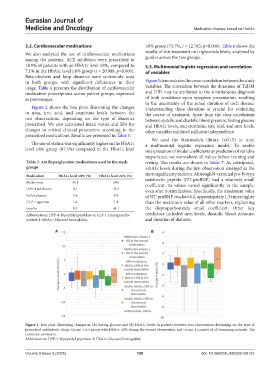
A B
Figure 1. Box plots illustrating changes in (A) fasting glucose and (B) HbA1c levels in patients between two observations depending on the type of
prescribed antidiabetic drugs. Group 1 is a group with HbA1c ≤8% during the second observation, and Group 2 consists of all remaining patients. The
colors are consistent.
Abbreviations: DPP-4: Dipeptidyl peptidase-4; HbA1c: Glycated hemoglobin.
Volume 9 Issue 3 (2025) 189 doi: 10.36922/EJMO025160133