
Page 71 - GHES-1-1
P. 71
Global Health Econ Sustain Implication of close contact
In the cases of South Korea, we modeled the data from system: the level of effort put into contact tracing and the
February 15 , 2020 (day 1 in Figure 3) to August 7 , 2020. timing of when it begins. Here, we analyze two additional
th
th
Before this period, an intermediate stage was dominated limiting scenarios: (i) there is a delay in the healthcare
by imported cases until mid-February, when a super system’s response to the level of infected individuals, and
spreader event occurred in Daegu, followed by various (ii) the health-care system has a maximum capacity that
other outbreaks. While the initial response to COVID-19 cannot be exceeded.
was similar to that of MERS and SARS, South Korean
authorities raised the COVID-19 alert level on February 3.2.1. Delay in the reaction
23 , 2020, implementing stricter control measures in There are several tasks that have to be performed to
rd
hospitals and health centers (Shim et al., 2020; Peck, accomplish the contact tracing procedure. Each of
2020). In March, 18 Life Treatment Centers were opened, these tasks takes a certain amount of time to complete,
designed to test and isolate infected individuals, and by introducing delays in identifying new infected individuals.
April 20 , they had relaxed the social distancing policy that Not only does the time needed to perform a PCR test
th
had been implemented at the beginning of the epidemic on an individual cause delays but also the public health
(Choi & Ki, 2020). system also cannot react instantaneously and needs a
certain amount of time to process the information and
To incorporate in the model the changes in health
policies during the evolution of the epidemic, we redirect their actions to close contacts of those infected.
It could take several days from the time that a positive test
introduced two different sigmoid functions, θ(t) = θ (t) + is obtained to complete the scanning of all close contacts.
1
θ (t), which represent the initial and improved tracking
2
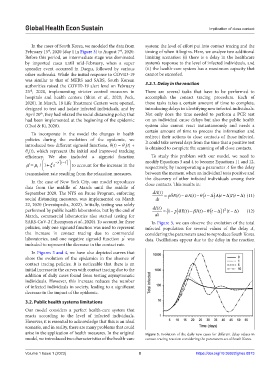
efficiency. We also included a sigmoid function To study this problem with our model, we need to
τ
γ − ( ) ' modify Equations 3 and 4 to become Equations 11 and 12,
'
− t
'
µ' = µ / 1 + ξ e to account for the increase in the respectively, by incorporating a parameter Δ for the delay
1
transmission rate resulting from the relaxation measures. between the moment when an individual tests positive and
the discovery of other infected individuals among their
In the case of New York City, our model reproduces close contacts. This results in:
data from the middle of March until the middle of
September 2020. The NYS on Pause Program, enforcing dA t () = pE t()−δ α A t()− ( t − ) At( − ∆ ) It( − ∆ (11)
)
θ
∆
social distancing measures, was implemented on March dt
22, 2020 (Investopedia, 2022). Initially, testing was solely
performed by public health laboratories, but by the end of dI t () =(1 − ) β I t()− ( t − ) It( − ∆ ) (12)
2
∆
pE t()−δ
θ
March, commercial laboratories also started testing for dt
SARS-CoV-2 (Thompson et al., 2020). To account for these In Figure 5, we can observe the evolution of the total
policies, only one sigmoid function was used to represent infected population for several values of the delay Δ,
the increase in contact tracing due to commercial considering the parameters used to reproduce South Korea
'
laboratories, and one negative sigmoid function µ was data. Oscillations appear due to the delay in the reaction
included to represent the decrease in the contact rate.
In Figures 3 and 4, we have also depicted curves that
show the evolution of the epidemics in the absence of
contact tracing policies. It is noticeable that there is an
initial increase in the curves with contact tracing due to the
addition of daily cases found from testing asymptomatic
individuals. However, this increase reduces the number
of infected individuals in society, leading to a significant
decrease in the impact of the epidemic.
3.2. Public health systems limitations
Our model considers a perfect health-care system that
reacts according to the level of infected individuals.
However, it is essential to acknowledge that this is an ideal
scenario, and in reality, there are many problems that could
arise in the application of health measures. In the original Figure 5. Evolution of the daily new cases for different delay values in
model, we introduced two characteristics of the health-care contact tracing reaction considering the parameters set of South Korea.
Volume 1 Issue 1 (2023) 8 https://doi.org/10.36922/ghes.0873