
Page 68 - GHES-1-1
P. 68
Global Health Econ Sustain Implication of close contact
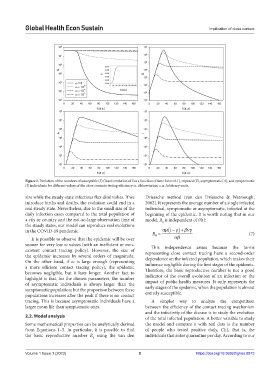
Figure 1. Evolution of the numbers of susceptible (S) (Inset: evolution of θ as a function of time for ω=0.1), exposed (E), asymptomatic (A), and symptomatic
(I) individuals for different values of the close contacts testing efficiency ω. Abbreviation: a.u: Arbitrary units.
size while the steady-state infectious flux diminishes. If we Driessche method (van den Driessche & Watmough,
introduce births and deaths, the evolution could end in a 2002). It represents the average number of a single infected
real steady state. Nevertheless, due to the small size of the individual, symptomatic or asymptomatic, infected at the
daily infection cases compared to the total population of beginning of the epidemic. It is worth noting that in our
a city or country and the not-so-large observation time of model, R is independent of θ(t):
0
the steady states, our model can reproduce real evolutions
in the COVID-19 pandemic. αµ 1− ( p) + βν p
R = (7)
0
It is possible to observe that the epidemic will be over αβ
sooner for very low ω values (with an inefficient or non- This independence arises because the terms
existent contact tracing policy). However, the size of representing close contact tracing have a second-order
the epidemic increases by several orders of magnitude. dependence on the infected population, which makes their
On the other hand, if ω is large enough (representing influence negligible during the first stages of the epidemic.
a more efficient contact tracing policy), the epidemic
becomes negligible, but it lasts longer. Another fact to Therefore, the basic reproductive number is not a good
highlight is that, for the chosen parameters, the number indicator of the overall evolution of an infection or the
of asymptomatic individuals is always larger than the impact of public health measures. It only represents the
symptomatic population; but the proportion between these early stages of the epidemic, when the population is almost
populations increases after the peak if there is no contact entirely susceptible.
tracing. This is because asymptomatic individuals have a A simpler way to analyze the competition
larger mean life than symptomatic ones. between the efficiency of the contact tracing mechanism
and the infectivity of the disease is to study the evolution
2.2. Model analysis of the total infected population. A better variable to study
Some mathematical properties can be analytically derived the model and compare it with real data is the number
from Equations 1–5. In particular, it is possible to find of people who tested positive daily, C(t), that is, the
the basic reproductive number R using the van den individuals that enter quarantine per day. According to our
0
Volume 1 Issue 1 (2023) 5 https://doi.org/10.36922/ghes.0873