
Page 70 - GHES-1-1
P. 70
Global Health Econ Sustain Implication of close contact
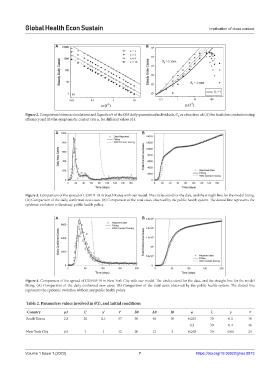
A B
Figure 2. Comparison between simulations and Equation 9 of the QSS daily quarantined individuals, C as a function of; (A) the final close contacts testing
S,
efficiency and (B) the symptomatic contact rate µ, for different values of k.
A B
Figure 3. Comparison of the spread of COVID-19 in South Korea with our model. The circles stand for the data, and the straight line for the model fitting.
(A) Comparison of the daily confirmed new cases. (B) Comparison of the total cases observed by the public health system. The dotted line represents the
epidemic evolution without any public health policy.
A B
Figure 4. Comparison of the spread of COVID-19 in New York City with our model. The circles stand for the data, and the straight line for the model
fitting. (A) Comparison of the daily confirmed new cases. (B) Comparison of the total cases observed by the public health system. The dotted line
represents the epidemic evolution without any public health policy.
Table 2. Parameters values involved in θ(t), and initial conditions
Country µ1 ξʹ γʹ τʹ E0 A0 I0 ω ξ γ τ
South Korea 2.8 20 0.1 57 50 40 10 0.025 30 0.5 10
0.3 30 0.4 46
New York City 0.5 1 1 12 20 12 3 0.048 30 0.06 24
Volume 1 Issue 1 (2023) 7 https://doi.org/10.36922/ghes.0873