
Page 46 - GHES-1-2
P. 46
Global Health Econ Sustain Social support and health in musculoskeletal disorders
According to Table 4, most of the sample (78.3%) had musculoskeletal health problems, with 1 year being the
retired, 16.0% were homemakers, 3.8% were workers, and shortest while 70 years being the longest.
the remaining 1.9% were unemployed. According to Table 7, 55.7% of the sample reported
Regarding the type of occupational status in the taking medication to treat musculoskeletal health problems
past, 50.0% of the sample had an occupation involving while the remaining 44.3% reported otherwise. Further, for
moderate/light manual work, 29.2% of the sample were 55.7% of the sample that reported receiving medications to
involved in heavy manual work, and the remaining 20.8% treat musculoskeletal health problems, the mean duration
of the sample reported non-manual work. of taking these drugs was 10.5 years with a standard
deviation of 10.6. The shortest duration was 1 year and the
Based on Table 5, 21.7% of the sample reported having a longest was 60 years. Furthermore, 51.9% of the sample
paid/unpaid helper, while 78.3% of the sample did not have described their musculoskeletal health problems as at least
a helper. Moreover, 35.8% of the sample reported that they quite serious, while 48.1% of the sample characterized
were in a good financial condition, 37.7% in a moderate their situations as not at all or somewhat serious.
financial condition, and the remaining 26.4% in a poor or
very poor financial condition. It was also observed that According to Table 8, the health locus of control of the
41.5% of the sample lived in semi-urban area, 39.65 in an sample was at moderate level regarding internal (24.3±4.8),
urban area, and the remaining 18.9% in a rural area. chance (20.2±5.1), doctors (13.9±2.8), and others
(11.5±3.8). We also observed that the pain self-efficacy of
Regarding the insurance coverage, 86.8% of the sample the respondents was at a moderate level (32.0±13.5).
reported having public insurance coverage, 5.7% having
private insurance coverage, and 7.55% having both private According to Table 9, overall social support (4.6 ± 0.9),
and public insurance coverages (Table 6). The sample family support (5.1 ± 1.2) and support from significant
also reported that they spent an average of 16.6 years others (5.0 ± 1.2) were at high level, while the support from
(with a standard deviation of 14.1 years) in dealing with friends was at a moderate level (3.6 ± 1.5).
Kolmogorov–Smirnov and Shapiro–Wilk tests
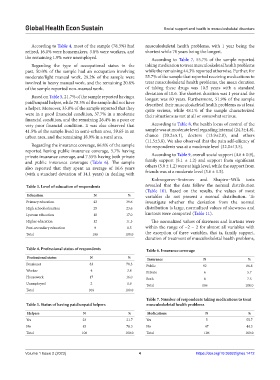
Table 3. Level of education of respondents revealed that the data follow the normal distribution
(Table 10). Based on the results, the values of most
Education Ν % variables do not present a normal distribution. To
Primary education 42 39.6 investigate whether the deviation from the normal
High school education 25 23.6 distribution is large, normalized values of skewness and
Lyceum education 18 17.0 kurtosis were computed (Table 11).
Higher education 12 11.3 The normalized values of skewness and kurtosis were
Post-secondary education 9 8.5 within the range of −2 – 2 for almost all variables with
Total 106 100.0 the exception of three variables, that is, family support,
duration of treatment of musculoskeletal health problems,
Table 4. Professional status of respondents Table 6. Insurance coverage
Professional status Ν % Insurance Ν %
Pensioner 83 78.3 Public 92 86.8
Worker 4 3.8 Private 6 5.7
Housework 17 16.0 Both 8 7.5
Unemployed 2 1.9 Total 106 100.0
Total 106 100.0
Table 7. Number of respondents taking medications to treat
Table 5. Status of having paid/unpaid helpers musculoskeletal health problems
Helpers Ν % Medications Ν %
Yes 23 21.7 Yes 5 55.7
No 83 78.3 No 47 44.3
Total 106 100.0 Total 106 100.0
Volume 1 Issue 2 (2023) 4 https://doi.org/10.36922/ghes.1412