
Page 49 - GHES-1-2
P. 49
Global Health Econ Sustain Social support and health in musculoskeletal disorders
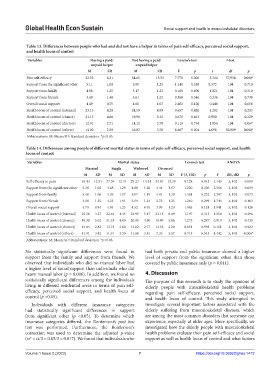
Table 13. Differences between people who had and did not have a helper in terms of pain self‑efficacy, perceived social support,
and health locus of control
Variables Having a paid/ Not having a paid/ Levene’s test t‑test
unpaid helper unpaid helper
Μ SD Μ SD F p t df p
Pain self-efficacy 22.52 8.31 34.65 13.55 7.770 0.006 −5.314 57,934 0.000*
Support from the significant other 5.11 1.00 5.00 1.25 1.141 0.288 0.373 104 0.710
Support from family 4.88 1.25 5.17 1.22 0.160 0.690 −1.021 104 0.310
Support from friends 3.49 1.48 3.61 1.52 0.368 0.546 −0.336 104 0.738
Overall social support 4.49 0.75 4.60 1.03 2.463 0.120 −0.446 104 0.656
Health locus of control (internal) 23.13 4.20 24.59 4.99 0.657 0.420 −1.282 104 0.203
Health locus of control (chance) 21.13 4.66 19.96 5.15 0.676 0.413 0.980 104 0.329
Health locus of control (doctors) 12.91 2.71 14.12 2.78 0.116 0.734 −1.854 104 0.067
Health locus of control (others) 14.00 2.58 10.82 3.76 8.667 0.004 4.698 50.809 0.000*
Abbreviations: M: Mean; SD: Standard deviation. *p<0.05.
Table 14. Differences among people of different marital status in terms of pain self‑efficacy, perceived social support, and health
locus of control
Variables Marital status Levene’s test ANOVA
Married Single Widowed Divorced
Μ SD Μ SD Μ SD Μ SD F (3, 102) p F df1, df2 p
Self-efficacy in pain 35.44 12.51 27.36 12.41 29.23 14.24 34.67 13.39 0.128 0.943 2.143 3, 102 0.099
Support from the significant other 5.38 1.02 4.68 1.29 4.88 1.20 4.44 1.57 1.220 0.306 2.566 3, 102 0.059
Support from family 5.40 1.06 4.39 1.57 5.07 1.19 4.81 1.39 1.454 0.232 2.387 3, 102 0.073
Support from friends 3.58 1.55 4.25 1.91 3.59 1.34 2.72 1.25 1.240 0.299 1.744 3, 102 0.163
Overall social support 4.79 0.84 4.44 1.23 4.52 0.93 3.99 1.29 1.963 0.124 1.941 3, 102 0.128
Health locus of control (internal) 25.26 4.27 22.64 4.43 23.95 5.17 23.11 6.09 1.197 0.315 1.250 3, 102 0.296
Health locus of control (chance) 19.30 5.62 21.18 4.00 20.95 4.50 19.89 5.86 1.275 0.287 0.919 3, 102 0.435
Health locus of control (doctors) 13.84 2.82 13.73 2.80 14.02 2.77 13.33 3.20 0.031 0.993 0.161 3, 102 0.923
Health locus of control (others) 11.91 3.42 11.91 3.30 11.88 3.81 7.33 3.57 0.715 0.545 4.442 3, 102 0.006*
Abbreviations: M: Mean; SD: Standard deviation. *p<0.05.
No statistically significant differences were found in had both private and public insurance showed a higher
support from the family and support from friends. We level of support from the significant other than those
observed that individuals who did no manual labor had covered by public insurance only (p = 0.011).
a higher level of social support than individuals who did
heavy manual labor (p = 0.006). In addition, we found no 4. Discussion
statistically significant differences among the individuals The purpose of this research is to study the opinions of
living in different residential areas in terms of pain self- elderly people with musculoskeletal health problems
efficacy, perceived social support, and health locus of regarding pain self-efficacy, perceived social support,
control (p >0.05). and health locus of control. This study attempted to
Individuals with different insurance categories investigate several important factors associated with the
had statistically significant differences in support elderly suffering from musculoskeletal diseases, which
from significant other (p <0.05). To determine which are among the most common disorders that someone can
insurance categories differed, the Bonferroni’s post hoc experience, especially at older ages. More specifically, we
test was performed. Furthermore, the Bonferroni’s investigated how the elderly people with musculoskeletal
correction was used to determine the adjusted p-value health problems evaluate their pain self-efficacy and social
(α* = α/3 = 0.05/3 = 0.017). We found that individuals who support as well as health locus of control and what factors
Volume 1 Issue 2 (2023) 7 https://doi.org/10.36922/ghes.1412