
Page 48 - GHES-1-2
P. 48
Global Health Econ Sustain Social support and health in musculoskeletal disorders
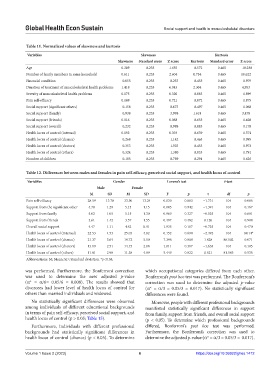
Table 11. Normalized values of skewness and kurtosis
Variables Skewness Kurtosis
Skewness Standard error Z score Kurtosis Standard error Z score
Age 0.389 0.235 1.655 −0.572 0.465 −10.230
Number of family members in same household 0.611 0.235 2.604 0.754 0.465 10.622
Financial condition −0.055 0.235 −0.233 −0.455 0.465 −0.979
Duration of treatment of musculoskeletal health problems 1.418 0.235 6.043 2.304 0.465 4.953
Severity of musculoskeletal health problems 0.075 0.235 0.320 −0.883 0.465 −1.899
Pain self-efficacy 0.169 0.235 0.721 −0.872 0.465 −1.875
Social support (significant others) −0.158 0.235 −0.673 −0.497 0.465 −1.068
Social support (family) −0.938 0.235 −3.998 1.618 0.465 3.478
Social support (friends) 0.016 0.235 0.068 −0.655 0.465 −1.408
Social support (overall) −0.232 0.235 −0.988 −0.083 0.465 −0.178
Health locus of control (internal) 0.092 0.235 0.393 −0.639 0.465 −1.374
Health locus of control (chance) −0.268 0.235 −1.142 −0.463 0.465 −0.995
Health locus of control (doctors) −0.353 0.235 −1.503 −0.453 0.465 −0.973
Health locus of control (others) −0.324 0.235 −1.380 −0.833 0.465 −1.791
Number of children −0.185 0.235 −0.789 −0.291 0.465 −0.626
Table 12. Differences between males and females in pain self‑efficacy, perceived social support, and health locus of control
Variables Gender Levene’s test t‑test
Male Female
Μ SD Μ SD F p t df p
Pain self-efficacy 28.59 13.78 33.50 13.24 0.030 0.863 −1.731 104 0.086
Support from the significant other 4.78 1.29 5.13 1.15 0.005 0.942 −1.391 104 0.167
Support from family 5.02 1.05 5.15 1.30 0.969 0.327 −0.525 104 0.601
Support from friends 3.61 1.42 3.57 1.55 0.497 0.482 0.120 104 0.904
Overall social support 4.47 1.11 4.62 0.91 1.935 0.167 −0.725 104 0.470
Health locus of control (internal) 22.53 4.53 25.03 4.82 0.152 0.698 −2.492 104 0.014*
Health locus of control (chance) 21.37 3.64 19.72 5.50 7.396 0.008 1.828 86.502 0.071
Health locus of control (doctors) 13.19 2.51 14.15 2.88 1.011 0.317 −1,638 104 0.105
Health locus of control (others) 11.81 2.90 11.38 4.09 5.449 0.022 0.621 81.545 0.536
Abbreviations: M: Mean; SD: Standard deviation. *p<0.05.
was performed. Furthermore, the Bonferroni correction which occupational categories differed from each other,
was used to determine the new adjusted p-value Bonferroni’s post hoc test was performed. The Bonferroni’s
(α* = α/6= 0.05/6 = 0.008). The results showed that correction was used to determine the adjusted p-value
divorcees had lower level of health locus of control for (α* = α/3 = 0.05/3 = 0.017). No statistically significant
others than married individuals and widowed. differences were found.
No statistically significant differences were observed Moreover, people with different professional backgrounds
among individuals of different educational backgrounds manifested statistically significant differences in support
in terms of pain self-efficacy, perceived social support, and from family, support from friends, and overall social support
health locus of control (p > 0.05; Table 15). (p < 0.05). To determine which professional backgrounds
Furthermore, individuals with different professional differed, Bonferroni’s post hoc test was performed.
backgrounds had statistically significant differences in Furthermore, the Bonferroni’s correction was used to
health locus of control (chance) (p < 0.05). To determine determine the adjusted p-value (α* = α/3 = 0.05/3 = 0.017).
Volume 1 Issue 2 (2023) 6 https://doi.org/10.36922/ghes.1412