
Page 47 - GHES-1-2
P. 47
Global Health Econ Sustain Social support and health in musculoskeletal disorders
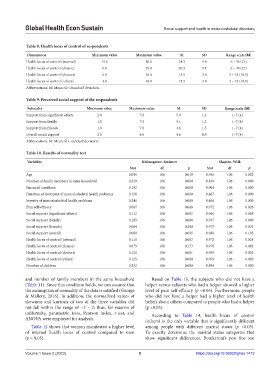
Table 8. Health locus of control of respondents
Dimensions Minimum value Maximum value Μ SD Range scale (Μ)
Health locus of control (internal) 15.0 36.0 24.3 4.8 6 – 36 (21)
Health locus of control (chance) 6.0 29.0 20.2 5.1 6 – 36 (21)
Health locus of control (doctors) 6.0 18.0 13.9 2.8 3 – 18 (10,5)
Health locus of control (others) 3.0 18.0 11.5 3.8 3 – 18 (10,5)
Abbreviations: M: Mean; SD: Standard deviation.
Table 9. Perceived social support of the respondents
Subscales Minimum value Maximum value Μ SD Range scale (Μ)
Support from significant others 2.0 7.0 5.0 1.2 1–7 (4)
Support from family 1.0 7.0 5.1 1.2 1–7 (4)
Support from friends 1.0 7.0 3.6 1.5 1–7 (4)
Overall social support 2.0 6.6 4.6 0.9 1–7 (4)
Abbreviations: M: Mean; SD, standard deviation.
Table 10. Results of normality test
Variables Kolmogorov–Smirnov Shapiro–Wilk
Stat df p Stat df p
Age 0.096 106 0.019 0.956 106 0.002
Number of family members in same household 0.229 106 0.000 0.839 106 0.000
Financial condition 0.192 106 0.000 0.904 106 0.000
Duration of treatment of musculoskeletal health problems 0.158 106 0.000 0.867 106 0.000
Severity of musculoskeletal health problems 0.241 106 0.000 0.866 106 0.000
Pain self-efficacy 0.087 106 0.048 0.972 106 0.026
Social support (significant others) 0.112 106 0.002 0.966 106 0.008
Social support (family) 0.105 106 0.006 0.937 106 0.000
Social support (friends) 0.064 106 0.200 0.973 106 0.032
Social support (overall) 0.080 106 0.095 0.980 106 0.105
Health locus of control (internal) 0.111 106 0.003 0.972 106 0.024
Health locus of control (chance) 0.075 106 0.173 0.978 106 0.082
Health locus of control (doctors) 0.121 106 0.001 0.959 106 0.003
Health locus of control (others) 0.125 106 0.000 0.956 106 0.002
Number of children 0.252 106 0.000 0.894 106 0.000
and number of family members in the same household Based on Table 13, the subjects who did not have a
(Table 11). Since this condition holds, we can assume that helper versus subjects who had a helper showed a higher
the assumption of normality of the data is satisfied (George level of pain self-efficacy (p <0.05). Furthermore, people
& Mallery, 2016). In addition, the normalized values of who did not have a helper had a higher level of health
skewness and kurtosis of two of the three variables did beliefs about others compared to people who had a helper
not fall within the range of −2 – 2; thus, for reasons of (p <0.05).
uniformity, parametric tests, Pearson index, t-test, and According to Table 14, health locus of control
ANOVA were employed for analysis. (others) is the only variable that is significantly different
Table 12 shows that women manifested a higher level among people with different marital status (p <0.05).
of internal health locus of control compared to men To exactly determine the marital status categories that
(p < 0.05). show significant differences, Bonferroni’s post hoc test
Volume 1 Issue 2 (2023) 5 https://doi.org/10.36922/ghes.1412