
Page 106 - GHES-2-1
P. 106
Global Health Econ Sustain Distress in Spanish women through COVID-19
the general population aged 16 – 87 years. A total of 21.2% having never been married, and being employed or
(n = 858) completed the questionnaires during the first enrolled as students. The mean age of the participants
wave of COVID-19, at the conclusion of the nationwide ranged from 36.29 ± 16.26 years during the lockdown to
lockdown, between June 1 and June 17, 2020. Subsequently, 30.25 ± 14.88 years during the second wave. Regarding
34.6% (n = 1,402) completed the questionnaires during parenthood, more than half of the participants (67.6%)
the second wave of COVID-19 in Spain between October did not have children, with the number of children among
15 and December 16, 2020. In addition, 14.9% (n = 602) those who did ranging from 1 to 8. Among those with
completed the questionnaires 2 years after the pandemic children, having two (17.2%) or one child (10.5%) was the
began, between February 9 and April 27, 2022. Finally, most common scenario, while 3.6% reported having three
29.3% (n = 1185) completed the questionnaires 2 years children, and 1% reported more than three children.
after the conclusion of the second wave, between October We collected data using an online survey administered
5, 2022, and February 25, 2023. through a Google Form. The sampling method employed
was snowball sampling and convenience. Access to
2.1. Participants and procedure
participants was facilitated through the researchers’ social
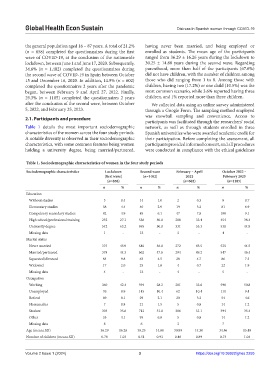
Table 1 details the most important sociodemographic network, as well as through students enrolled in three
characteristics of the women across the four study periods. Spanish universities who were awarded academic credit for
A notable diversity is observed in their sociodemographic their participation. Before completing the assessment, all
characteristics, with some common features being women participants provided informed consent, and all procedures
holding a university degree, being married/partnered, were conducted in compliance with the ethical guidelines
Table 1. Sociodemographic characteristics of women in the four study periods
Sociodemographic characteristics Lockdown Second wave February – April October 2022 –
(first wave) (n=1402) 2022 February 2023
(n=858) (n=602) (n=1185)
n % n % n % n %
Education
Without studies 3 0.4 14 1.0 2 0.3 8 0.7
Elementary studies 38 4.4 40 2.9 19 3.2 81 6.9
Compulsory secondary studies 42 4.9 85 6.1 47 7.8 108 9.1
High school/professional training 232 27.1 556 40.0 200 33.4 454 38.4
University degree 542 63.2 695 50.0 331 55.3 530 44.9
Missing data 1 - 12 - 3 - 4 -
Marital status
Never married 375 43.9 640 46.0 272 45.5 525 44.5
Married/partnered 378 44.3 662 47.6 294 49.2 547 46.4
Separated/divorced 84 9.8 63 4.5 28 4.7 86 7.3
Widowed 17 2.0 25 1.8 4 0.7 22 1.9
Missing data 4 - 12 - 4 - 5 -
Occupation
Working 360 42.4 394 28.2 201 33.6 598 50.8
Unemployed 76 8.9 145 10.4 62 10.4 111 9.4
Retired 69 8.1 29 2.1 20 3.3 54 4.6
Homemaker 7 0.8 21 1.5 5 0.8 14 1.2
Student 303 35.6 712 51.0 306 51.1 394 33.4
Other 35 4.1 95 6.8 5 0.8 14 1.2
Missing data 8 6 3 7
Age (mean±SD) 36.29 16.26 30.25 14.88 30.99 14.30 34.86 15.48
Number of children (mean±SD) 0.70 1.03 0.51 0.93 0.46 0.89 0.73 1.04
Volume 2 Issue 1 (2024) 3 https://doi.org/10.36922/ghes.2255