
Page 110 - GHES-2-1
P. 110
Global Health Econ Sustain Distress in Spanish women through COVID-19
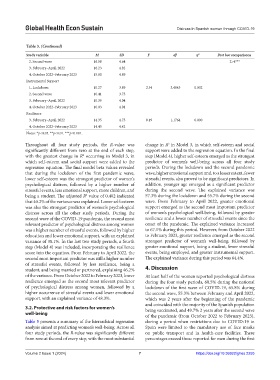
Table 3. (Continued)
Study variable M SD F df η 2 Post hoc comparisons
2. Second wave 16.58 4.64 2>4***
3. February–April, 2022 16.23 4.82
4. October 2022–February 2023 15.80 4.89
Instrumental Support
1. Lockdown 10.27 3.89 2.34 3,4043 0.002
2. Second wave 10.41 3.75
3. February–April, 2022 10.39 4.04
4. October 2022–February 2023 10.03 4.01
Resilience
3. February–April, 2022 14.35 4.75 0.19 1,1764 0.000
4. October 2022–February 2023 14.45 4.42
Notes: *p<0.05. **p<0.01. ***p<0.001.
Throughout all four study periods, the R-value was change in R in Model 3, in which self-esteem and social
2
significantly different from zero at the end of each step, support were added to the regression equation. In the final
with the greatest change in R occurring in Model 3, in step (Model 4), higher self-esteem emerged as the strongest
2
which self-esteem and social support were added to the predictor of women’s well-being across all four study
regression equation. The final model beta values revealed periods. During the lockdown and the second pandemic
that during the lockdown of the first pandemic wave, wave, higher emotional support and, to a lesser extent, fewer
lower self-esteem was the strongest predictor of women’s stressful events, also proved to be significant predictors. In
psychological distress, followed by a higher number of addition, younger age emerged as a significant predictor
stressful events, less emotional support, more children, and during the second wave. The explained variance was
2
being a student. The adjusted R value of 0.402 indicated 57.3% during the lockdown and 55.7% during the second
that 40.2% of the variance was explained. Lower self-esteem wave. From February to April 2022, greater emotional
was also the strongest predictor of women’s psychological support emerged as the second most important predictor
distress across all the other study periods. During the of women’s psychological well-being, followed by greater
second wave of the COVID-19 pandemic, the second most resilience and a lower number of stressful events since the
relevant predictor of psychological distress among women onset of the pandemic. The explained variance increased
was a higher number of stressful events, followed by higher to 67.1% during this period. However, from October 2022
education and lower emotional support, with an explained to February 2023, greater resilience emerged as the second
variance of 38.1%. In the last two study periods, a fourth strongest predictor of women’s well-being, followed by
step (Model 4) was included, incorporating the resilience greater emotional support, being a student, fewer stressful
score into the equation. From February to April 2022, the events, being employed, and greater instrumental support.
second most important predictor was still a higher number The explained variance during this period was 64.4%.
of stressful events, followed by less resilience, being a
student, and being married or partnered, explaining 46.2% 4. Discussion
of the variance. From October 2022 to February 2023, lower At least half of the women reported psychological distress
resilience emerged as the second most relevant predictor during the four study periods, 60.5% during the national
of psychological distress among women, followed by a lockdown of the first wave of COVID-19, 65.8% during
higher occurrence of stressful events and lower emotional the second wave, 55.3% between February and April 2022,
support, with an explained variance of 48.3%. which was 2 years after the beginning of the pandemic
and coincided with the majority of the Spanish population
3.2. Protective and risk factors for women’s being vaccinated, and 49.7% 2 years after the second wave
well-being
of the pandemic (from October 2022 to February 2023),
Table 5 presents a summary of the hierarchical regression during a period when restrictions due to COVID-19 in
analysis aimed at predicting women’s well-being. Across all Spain were limited to the mandatory use of face masks
four study periods, the R-value was significantly different on public transport and in health-care facilities. These
from zero at the end of every step, with the most substantial percentages exceed those reported for men during the first
Volume 2 Issue 1 (2024) 7 https://doi.org/10.36922/ghes.2255