
Page 157 - GHES-2-1
P. 157
Global Health Econ Sustain Total sugar consumption Philippines
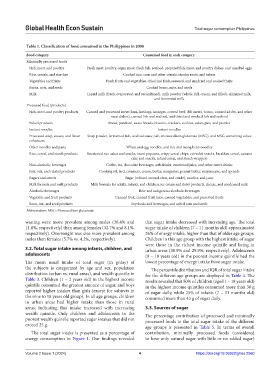
Table 1. Classification of food consumed in the Philippines in 2008
Food category Consumed food in each category
Minimally processed foods
Fish, meat, and poultry Fresh meat, poultry, organ meat, fresh fish, seafood, prepared fish, meat, and poultry dishes, and unsalted eggs
Rice, cereals, and starches Cooked rice, corn and other cereals, starchy roots, and tubers
Vegetables and fruits Fresh fruits and vegetables, dried and fresh seaweed, and sundried and cooked fruits
Beans, nuts, and seeds Cooked beans, nuts, and seeds
Milk Liquid milk (fresh, evaporated, and recombined), milk powder (whole, full-cream, and filled), skimmed milk,
and fermented milk
Processed food (products)
Fish, meat, and poultry products Canned and processed meat (ham, hotdogs, sausages, corned beef, deli meats, tocino, canned adobo, and other
meat dishes), canned fish and seafood, and dried and smoked fish and seafood
Baked products Bread, pandesal, sweet breads, biscuits, crackers, cookies, cakes, pies, and pastries
Instant noodles Instant noodles
Processed soup, sauces, and flavor Soup powder, fermented fish, seafood sauce, salt, monosodium glutamate (MSG), and MSG-containing cubes
enhancers
Other noodles and pasta Wheat and egg noodles, and rice and mung bean noodles
Rice, cereal, and starch products Sweetened rice cakes and snacks, sweet popcorn, crispy cereal chips, extruded snacks, breakfast cereal, cassava
cake and snacks, infant cereal, and starch wrappers
Non-alcoholic beverages Coffee, tea, chocolate beverages, soft drinks, sweetened juice, and other sweet drinks
Fats, oils, and related products Cooking oil, lard, creamers, cream, butter, margarine, peanut butter, mayonnaise, and spreads
Sugars and sweets Sugar (refined, second-class, and crude), candies, and jams
Milk formula and milk products Milk formula for adults, infants, and children, ice cream and dairy products, cheese, and condensed milk
Alcoholic beverages Beer and indigenous alcoholic beverages
Vegetable and fruit products Canned fruit, canned fruit juice, canned vegetables, and preserved fruits
Bean, nut, and seed products Soy foods and beverages, and salted nuts and seeds
Abbreviation: MSG: Monosodium glutamate.
wasting were more prevalent among males (36.4% and that sugar intake decreased with increasing age. The total
11.8%, respectively) than among females (32.7% and 8.1%, sugar intake of children (7 – 11 months old) approximated
respectively). Overweight was also more prevalent among 26% of energy intake, higher than that of older age groups.
males than females (5.7% vs. 4.2%, respectively). Children in this age group with the highest intake of sugar
were those in the richest income quintile and living in
3.2. Total sugar intake among infants, children, and urban areas (30.9% and 29.9%, respectively). Adolescents
adolescents (9 – 18 years old) in the poorest income quintile had the
The mean usual intake of total sugar (in g/day) of lowest percentage of energy intake from sugar intake.
the subjects is categorized by age and sex, population The percentile distribution and IQR of total sugar intake
distribution (urban vs. rural areas), and wealth quintile in for the different age groups are displayed in Table 4. The
Table 3. Children (1 – 2 years old) in the highest income results revealed that 50% of children (aged 1 – 18 years old)
quintile consumed the greatest amount of sugar, and boys in the highest income quintiles consumed more than 30 g
reported higher intakes than girls (except for subjects in of sugar daily, while 25% of infants (7 – 11 months old)
the nine to 18 years old group). In all age groups, children consumed more than 43 g of sugar daily.
in urban areas had higher intake than those in rural
areas, indicating that intake increased with increasing 3.3. Sources of sugar
wealth quintile. Only children and adolescents in the The percentage contribution of processed and minimally
poorest wealth quintile reported sugar intakes that did not processed foods to the total sugar intake of the different
exceed 25 g. age groups is presented in Table 5. In terms of overall
The total sugar intake is presented as a percentage of contribution, minimally processed foods (considered
energy consumption in Figure 1. Our findings revealed to have only natural sugar with little or no added sugar)
Volume 2 Issue 1 (2024) 4 https://doi.org/10.36922/ghes.2060