Page 161 - GHES-2-1
P. 161

Global Health Econ Sustain                                              Total sugar consumption Philippines


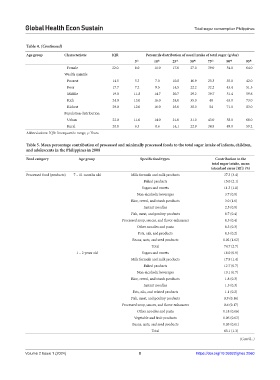
            Table 4. (Continued)
            Age group       Characteristic       IQR           Percentile distribution of usual intake of total sugar (g/day)
                                                          5 th     10 th  25 th   50 th  75 th   90 th    95 th
                              Female             22.0.    8.0      11.0   17.0    27.0    39.0   54.0     64.0
                            Wealth quintile
                              Poorest            14.5     5.3      7.0    10.8    16.9    25.3   35.0     42.0
                              Poor               17.7     7.2      9.5    14.5    22.2    32.2   43.4     51.3
                              Middle             19.0     11.8     14.7   20.7    29.2    39.7   51.4     59.6
                              Rich               24.0     13.0     16.0   24.0    35.0    48     63.0     73.0
                              Richest            29.0     12.0     16.0   25.0    38.0    54     71.0     83.0
                            Population distribution
                              Urban              22.0     11.0     14.0   21.0    31.0    43.0   58.0     68.0
                              Rural              20.8     6.3      8.6    14.1    22.9    34.9   49.0     59.2
            Abbreviations: IQR: Interquartile range; y: Years.

            Table 5. Mean percentage contribution of processed and minimally processed foods to the total sugar intake of infants, children,
            and adolescents in the Philippines in 2008

            Food category         Age group                  Specific food types             Contribution to the
                                                                                           total sugar intake, mean
                                                                                           (standard error [SE]) (%)
            Processed food (products)  7 – 11 months old  Milk formula and milk products        37.3 (3.4)
                                                              Baked products                    15.0 (2.1)
                                                             Sugars and sweets                  11.3 (1.8)
                                                           Non-alcoholic beverages               3.7 (0.9)
                                                         Rice, cereal, and starch products       3.0 (1.0)
                                                              Instant noodles                    2.5 (0.9)
                                                         Fish, meat, and poultry products        0.7 (0.4)
                                                     Processed soup, sauces, and flavor enhancers  0.5 (0.4)
                                                           Other noodles and pasta               0.3 (0.3)
                                                            Fats, oils, and products             0.3 (0.2)
                                                         Beans, nuts, and seed products         0.02 (1.02)
                                                                 Total                          74.7 (2.7)
                                  1 – 2 years old            Sugars and sweets                  18.0 (0.9)
                                                         Milk formula and milk products         17.9 (1.4)
                                                              Baked products                    12.7 (0.7)
                                                           Non-alcoholic beverages              10.1 (0.7)
                                                         Rice, cereal, and starch products       1.8 (0.3)
                                                              Instant noodles                    1.5 (0.3)
                                                         Fats, oils, and related products        1.1 (0.2)
                                                         Fish, meat, and poultry products       0.9 (0.16)
                                                     Processed soup, sauces, and flavor enhancers  0.6 (0.17)
                                                           Other noodles and pasta              0.18 (0.06)
                                                          Vegetable and fruit products          0.06 (0.03)
                                                         Beans, nuts, and seed products         0.05 (0.01)
                                                                 Total                          65.1 (1.3)
                                                                                                       (Cont’d...)


            Volume 2 Issue 1 (2024)                         8                        https://doi.org/10.36922/ghes.2060
   156   157   158   159   160   161   162   163   164   165   166