
Page 165 - GHES-2-1
P. 165
Global Health Econ Sustain Total sugar consumption Philippines
Philippines were overweight and obese (WHO Western
1.2* −2.2* 2.3* −0.1 0.6 1.4* −20.8* −58.0* 2.5* −7.0* 0.7* Pacific Region, 2017). In 2019, the Department of Health
and the Philippine Society of Endocrinology, Diabetes, and
Metabolism expressed concerns that the number of diabetic
9 – 18 years old 7.2 (0.3) 6.5 (0.2) 5.0 (0.2) 9.8 (0.5) 1.8 (0.4) 1.9 (0.2) 54.1 (1.4) 276.1 (2.7) 4.6 (0.3) 93.7 (1.4) 2.7 (0.2) Filipinos has reached seven million, indicating that diabetes
has reached epidemic proportion (ABS-CBN News, 2019).
Notably, a newspaper article reported that in 2020 during
6.0 (0.4) 8.7 (0.3) 2.7 (0.2) 9.9 (0.7) 1.1 (0.2) 0.5 (0.1) 74.9 (2.4) 334.1 (3.5) 2.0 (0.2) 100.7 (2.3) 2.1 (0.2) the pandemic, Filipino online searches for chocolates and
confectionery increased by 91% as compared to the online
searches in 2019 (Villanueva, 2021).
−0.4 −1.2* 1.7* 1.7* 0.2 1.0* −9.2* −37.0* 5.3* −1.1 0.3 4.1. Limitations of the study
A limitation of the present study was the use of the national
3 – 8 years old
food consumption data from 2008 to estimate the levels and
150.9 (2.2)
30.1 (1.0)
59.3 (1.2)
13.2 (0.7)
4.7 (0.2)
1.5 (0.2)
6.0 (0.4)
3.5 (0.2)
1.6 (0.2)
1.4 (0.3)
6.6 (0.4)
sources of sugar intake. However, changes in the consumption
Mean intake (standard error [SE]) (g/day) 6.4 (0.4) 0.2 5.9 (0.3) −0.7* 1.8 (0.2) 0.9* 4.9 (0.5) 0.8 1.2 (0.2) −0.6 0.6 (0.2) 1.3 39.3 (2.0) −2.4 187.9 (2.8) −27.1* 7.9 (0.8) 6.8* 60.4 (1.7) 1.1 1.2 (0.1) −0.3 proxy measurement and trend of recent sugar consumption.
of sugar were evaluated between 2008 and 2013 to provide a
Despite this limitation, this study was the only in-depth
assessment of sugar intake among Filipino children and
adolescents using nationally representative data.
Another limitation was the fact that only total sugars
(rather than natural vs. added sugar) could be analyzed
using food composition tables. It is also known that dietary
1 – 2 years old
assessment methods are imprecise due to measurement
establish the level of sugar intake. Recently, the δ C
13
biomarker, extracted from fingerstick blood samples, was
3.8 (0.4) 4.0 (0.4) 2.1 (0.1) 2.8 (0.2) 2.0 (0.2) 1.1 (0.2) 4.0 (0.4) 3.2 (0.5) 1.2 (0.4) 1.8 (0.5) 1.6 (0.6) 0.3 (0.2) 16.0 (1.1) 18.4 (1.4) 83.5 (3.5) 110.6 (4.5) 25.2 (1.7) 18.4 (1.5) 26.9 (1.2) 25.8 (1.5) 0.5 (0.1) 0.8 (0.2) errors, and biochemical methods are needed to definitively
reported to be a valid and sensitive biomarker of added
sugar and sugar-sweetened beverage intake in children and
adolescents (MacDougall et al., 2018).
−2.1* −0.3 0.5* 0.6 −0.8 - 2.1 −32.6* 2.6 −0.6 0.3 5. Conclusion
7 – 11 months old 0.3 (0.1) 0.4 (0.1) 0.7 (0.2) 1.0 (0.3) 0.4 (0.4) 0 4.2 (1.2) 52.7 (11.3) 12.9 (2.7) 4.2 (0.9) 0.4 (0.3) The present study reported that in 2008, the median intake
of total sugar among Filipino children aged 7 months to
18 years old ranged from 19 to 29.9 g/day. Among children
in the highest wealth quintiles, consumption exceeded
2.4 (0.9) 0.7 (0.3) 0.2 (0.1) 0.3 (0.2) 1.2 (0.7) 0 2.1 (0.6) 85.3 (12.2) 10.3 (2.6) 4.8 (0.9) 0.1 (0.01) 25 g/day. Total sugar comprised 5.3 – 30.9% of total energy
intake. Minimally processed foods contributed 31 – 36%
of total sugar, while processed foods contributed 64 – 75%
of total sugar, suggesting that added (rather than naturally
occurring) sugar is the predominant form of dietary sugar
in this group. The highest contributors were milk formula
and milk products (for children aged 7 – 11 months
confectionery (for children aged 7 – 11 months old and 1 –
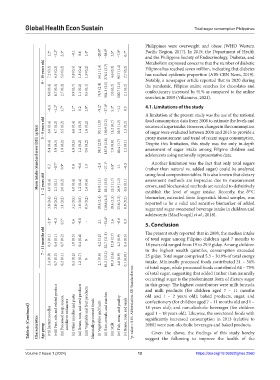
Table 6: (Continued) Characteristics Age group (vii) Instant noodles (viii) Fats, oils, and related product (ix) Processed soup, sauces, and flavor enhancers (x) Other noodles and pasta (xi) Beans, nuts, and seed products (xii) Vegetable and fruit products Minimally processed foods (i) Vegetables and fruits (ii) Rice, cereals, and starches (iii) Milk (iv) Fish, meat, and poultry (v) Beans, nuts, and seeds *p-value < 0.05. Abbreviation: SE: Sta
18 years old); and non-alcoholic beverages (for children
aged 1 – 18 years old). Likewise, the sweetened foods with
significantly increased consumption in 2013 (relative to
2008) were non-alcoholic beverages and baked products.
Given the above, the findings of this study hereby
Volume 2 Issue 1 (2024) 12 suggest the following to improve the health of the
https://doi.org/10.36922/ghes.2060