Page 162 - GHES-2-1
P. 162

Global Health Econ Sustain                                              Total sugar consumption Philippines


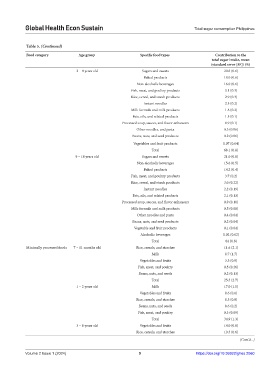
            Table 5. (Continued)
            Food category         Age group                  Specific food types             Contribution to the
                                                                                           total sugar intake, mean
                                                                                           (standard error [SE]) (%)
                                  3 – 8 years old            Sugars and sweets                  20.8 (0.6)
                                                              Baked products                    18.0 (0.6)
                                                           Non-alcoholic beverages              16.0 (0.6)
                                                         Fish, meat, and poultry products        3.1 (0.3)
                                                         Rice, cereal, and starch products       2.9 (0.3)
                                                              Instant noodles                    2.5 (0.2)
                                                         Milk formula and milk products          1.8 (0.2)
                                                         Fats, oils, and related products        1.5 (0.1)
                                                     Processed soup, sauces, and flavor enhancers  0.9 (0.1)
                                                           Other noodles, and pasta             0.3 (0.06)
                                                         Beans, nuts, and seed products         0.2 (0.06)

                                                          Vegetables and fruit products         0.07 (0.04)
                                                                 Total                          68.1 (0.8)
                                 9 – 18 years old            Sugars and sweets                  21.0 (0.6)
                                                           Non-alcoholic beverages              15.6 (0.5)
                                                              Baked products                    14.2 (0.4)
                                                         Fish, meat, and poultry products        3.7 (0.2)
                                                         Rice, cereal, and starch products      3.0 (0.22)
                                                              Instant noodles                   2.2 (0.19)
                                                         Fats, oils, and related products       2.1 (0.13)
                                                     Processed soup, sauces, and flavor enhancers  0.9 (0.10)
                                                         Milk formula and milk products         0.5 (0.08)
                                                           Other noodles and pasta              0.4 (0.04)
                                                         Beans, nuts, and seed products         0.2 (0.04)
                                                          Vegetable and fruit products          0.1 (0.04)
                                                             Alcoholic beverages                0.02 (0.02)
                                                                 Total                           64 (0.8)
            Minimally processed foods  7 – 11 months old   Rice, cereals, and starches          11.6 (2.1)
                                                                  Milk                           8.7 (1.7)
                                                            Vegetables and fruits                3.3 (0.9)
                                                            Fish, meat, and poultry             0.5 (0.26)
                                                            Beans, nuts, and seeds              0.2 (0.13)
                                                                 Total                          25.3 (2.7)
                                  1 – 2 years old                 Milk                          17.0 (1.0)
                                                            Vegetables and fruits                8.6 (0.6)
                                                           Rice, cereals, and starches           8.3 (0.8)
                                                            Beans, nuts, and seeds               0.6 (0.2)
                                                            Fish, meat, and poultry             0.3 (0.09)
                                                                 Total                          34.9 (1.3)
                                  3 – 8 years old           Vegetables and fruits               14.0 (0.6)
                                                           Rice, cereals, and starches          10.3 (0.6)
                                                                                                       (Cont’d...)

            Volume 2 Issue 1 (2024)                         9                        https://doi.org/10.36922/ghes.2060
   157   158   159   160   161   162   163   164   165   166   167