
Page 158 - GHES-2-1
P. 158
Global Health Econ Sustain Total sugar consumption Philippines
contributed 31 – 36% of total sugar, while processed foods sugar), followed by (in decreasing order) baked products
(considered to have added sugar) contributed 64 – 75% of (15%) and sugar and confectionery (11.3%). For children
total sugar. aged 1 – 2 years old, sugar and confectionery were the
highest contributor (18%), followed by milk formula and
3.3.1. Processed foods and food products milk products (17.9%), baked products (12.7%), and non-
For children aged 7 – 11 months old, milk formula and milk alcoholic beverages (10.1%). Sugar and confectionery were
products were the largest sources of sugar (37.3% of total the highest sugar contributors in the groups aged 3 – 8 years
old and 9 – 18 years old (20.8% and 21%, respectively). The
Table 2. Characteristics of subjects aged between 7 months other high sugar contributors in these two age groups were
old (mos) and 18 years old (yrs) in the Philippines in 2008 baked products (18% and 14.2%, respectively) and non-
according to the 7 National Nutrition Survey alcoholic beverages (16% and 15.6%, respectively).
th
Characteristic Male Female Total 3.3.2. Minimally processed foods
Number % Number % Number %
Age groups Minimally processed foods that contributed 10% or more
7 – 11 mos 114 2.1 108 2.3 222 2.2 to the total sugar intake of the different age groups were as
follows:
1 – 2 yrs 519 9.9 473 9.9 992 9.9 i. 7 – 11 months old: Rice, cereals, and starches (11.6% of
3 – 8 yrs 1,716 32.8 1,590 33.2 3306 33.0 total sugar)
9 – 18 yrs 2,831 55.2 2,550 54.7 5381 54.9 ii. 1 – 2 years old: Regular milk (17%)
Total 5180 100 4721 100 9901 100.0 iii. 3 – 8 years old: Vegetables and fruits (14%); and rice,
Location cereals, and starches (10.3%)
Urban 2,184 46.1 2,000 46.7 4184 46.4 iv. 9 – 18 years old: Vegetables and fruits (19.9%); and
Rural 2,996 53.8 2,721 53.3 5717 53.6 rice, cereals, and starches (12.8%).
Wealth quintile (Q) 3.4. Change in consumption of food sources of sugar
Q1 (poorest) 1488 26.0 1272 24.3 2760 25.2 from 2008 to 2013
Q2 1119 21.2 1011 20.7 2130 21.0 The changes in the consumption of processed and
Q3 1019 20.3 896 19.5 1915 19.9 minimally processed food groups between 2008 (Food and
Q4 863 17.8 822 18.8 1685 18.3 Nutrition Research Institute Philippines, 2008) and 2013
Q5 (wealthiest) 681 14.7 704 16.8 1385 15.7 (Food and Nutrition Research Institute Philippines, 2015)
Abbreviations: mos: Months; Q: Quintile; yrs: Years. are displayed in Table 6.
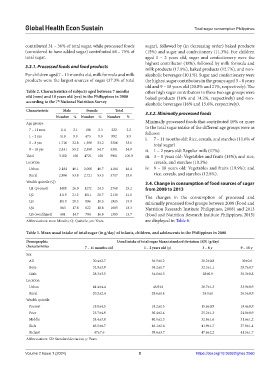
Table 3. Mean usual intake of total sugar (in g/day) of infants, children, and adolescents in the Philippines in 2008
Demographic Usual intake of total sugar Mean±standard deviation (SD) (g/day)
characteristics 7 – 11 months old 1 – 2 years old (y) 3 – 8 y 9 – 18 y
Sex
All 30.4±2.7 36.5±1.2 30.2±0.8 30±0.6
Boys 32.9±3.9 38.2±1.7 32.3±1.1 29.7±0.7
Girls 28.3±3.5 34.6±1.5 28±0.9 30.3±0.8
Location
Urban 41.4±4.4 45.9±2 36.7±1.3 33.9±0.9
Rural 20.2±2.4 28.6±1.4 24.9±1 26.5±0.9
Wealth quintile
Poorest 18.8±4.5 18.2±1.5 15.6±0.9 19.4±0.9
Poor 23.7±4.9 30.4±2.4 25.2±1.3 24.8±0.9
Middle 24.4±3.8 40.9±2.3 32.8±1.6 31.6±1.2
Rich 43.5±6.7 46.1±2.6 41.9±1.7 37.8±1.4
Richest 47±7.6 59.6±3.7 47.6±2.2 41.5±1.7
Abbreviations: SD: Standard deviation; y: Years.
Volume 2 Issue 1 (2024) 5 https://doi.org/10.36922/ghes.2060