
Page 163 - GHES-2-1
P. 163
Global Health Econ Sustain Total sugar consumption Philippines
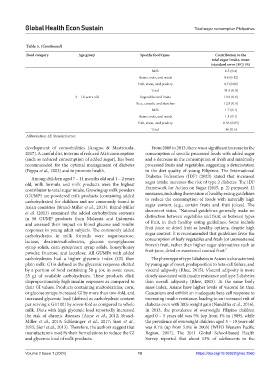
Table 5. (Continued)
Food category Age group Specific food types Contribution to the
total sugar intake, mean
(standard error [SE]) (%)
Milk 6.3 (0.4)
Beans, nuts, and seeds 0.9 (0.12)
Fish, meat, and poultry 0.5 (0.06)
Total 31.9 (0.9)
9 – 18 years old Vegetables and fruits 19.9 (0.6)
Rice, cereals, and starches 12.8 (0.5)
Milk 1.7 (0.1)
Beans, nuts, and seeds 1.1 (0.1)
Fish, meat, and poultry 0.56 (0.05)
Total 36 (0.6)
Abbreviation: SE: Standard error.
development of comorbidities (Aragno & Mastrocola, From 2008 to 2013, there was a significant increase in the
2017). A careful diet, in terms of reduced AGE consumption consumption of specific processed foods with added sugar
(such as reduced consumption of added sugar), has been and a decrease in the consumption of fresh and minimally
recommended for the optimal management of diabetes processed fruits and vegetables, suggesting a deterioration
(Peppa et al., 2003) and to promote health. in the diet quality of young Filipinos. The International
Among children aged 7 – 11 months old and 1 – 2 years Diabetes Federation (IDF) (2023) stated that increased
old, milk formula and milk products were the highest sugar intake increases the risk of type 2 diabetes. The IDF
contributor to total sugar intake. Growing up milk powders Framework for Action on Sugar (2015, p. 2) proposed 12
(GUMP) are powdered milk products (containing added measures, including the revision of healthy eating guidelines
carbohydrates) for children and are commonly found in to reduce the consumption of foods with naturally high
Asian countries (Brand-Miller et al., 2013). Brand-Miller sugar content (e.g., certain fruits and fruit juices). The
et al. (2013) examined the added carbohydrate contents document states, “National guidelines generally make no
in 58 GUMP products from Malaysia and Indonesia distinction between vegetables and fruit, or between types
and assessed their impact on blood glucose and insulin of fruit, in their healthy eating guidelines. Some include
responses in young adult subjects. The commonly added fruit juice or dried fruit as healthy options, despite high
carbohydrates in milk formula were sugar/sucrose, sugar content. It is recommended that guidelines favor the
lactose, dextrin/maltodextrin, glucose syrup/glucose consumption of leafy vegetables and fresh (or unsweetened
syrup solids, corn syrup/corn syrup solids, honey/honey frozen) fruit, rather than higher sugar alternatives such as
powder, fructose, and lactulose. All GUMPs with added fruit juice, dried or sweetened canned fruit.”
carbohydrates had a higher glycemic index (GI) than The phenotype of type 2 diabetes in Asians is characterized
plain milk. GI is defined as the glycemic response elicited by young age of onset, predisposition to beta-cell failure, and
by a portion of food containing 50 g (or, in some cases, visceral adiposity (Rhee, 2015). Visceral adiposity is more
25 g) of available carbohydrates. These products elicit closely associated with insulin resistance and type 2 diabetes
disproportionately high insulin responses as compared to than overall adiposity (Rhee, 2015). At the same body
their GI values. Products containing maltodextrins, corn, mass index, Asians have higher levels of visceral fat than
or glucose syrups increased GI by more than two-fold, and Caucasians and exhibit an inadequate beta-cell response to
increased glycemic load (defined as carbohydrate content increasing insulin resistance, leading to an increased risk of
per serving x GI/100) by seven-fold as compared to whole diabetes even with little weight gain (Nanditha et al., 2016).
milk. Diets with high glycemic load reportedly increased In 2013, the prevalence of overweight Filipino children
the risk of chronic diseases (Aune et al., 2012; Brand- aged 0 – 5 years old was 5% (up from 1% in 1989), while
Miller et al., 2013; Schlesinger et al., 2017; Sieri et al., the prevalence of overweight children aged 5 – 10 years old
2015; Sieri et al., 2013). Therefore, the authors suggest that was 9.1% (up from 5.8% in 2003) (WHO Western Pacific
manufacturers modify their formulations to reduce the GI Region, 2017). The 2011 Global School-based Health
and glycemic load of milk products. Survey reported that about 13% of adolescents in the
Volume 2 Issue 1 (2024) 10 https://doi.org/10.36922/ghes.2060