
Page 164 - GHES-2-1
P. 164
Global Health Econ Sustain Total sugar consumption Philippines
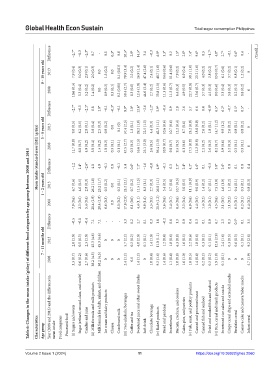
Difference −2.7* −0.3 −2.3* 0.7 - 0.5 0.3* 0.0 20.5* 2.9* 14.5* 3.4 −0.3 6.9* 3.3* 0.2 1.5* 2.0* 7.4* 9.6* 0.3 −1.7* 4.0* 2.7* −0.1 0.6* 0.4 - (Cont’d...)
9 – 18 years old 2013 7.9 (0.4) 5.0 (0.3) 2.9 (0.1) 2.0 (0.3) 0.0 1.3 (0.2) 0.0 0.1 (0.01) 79.9 (3.4) 3.2 (0.2) 26.9 (1.4) 47.4 (2.6) 2.4 (0.1) 40.7 (1.0) 14.6 (0.6) 11.4 (0.6) 7.9 (0.2) 6.9 (0.4) 30.1 (1.0) 23.2 (1.0) 4.0 (0.2) 2.8 (0.2) 13.0 (0.7) 6.1 (0.6) 3.7 (0.2) 0.8 (0.1) 1.2 (0.2) 0
2008 10.6 (0.5) 5.3 (0.4) 5.2 (0.2) 1.4 (0.2) 0.0 0.9 (0.2) 0.3 (0.1) 0.2 (0.01) 59.4 (2.7) 0.3 (0.0) 12.4 (1.0) 44.0 (2.4) 2.7 (0.2) 33.8 (1.1) 11.3 (0.6) 11.2 (0.7) 6.4 (0.3) 4.9 (0.5) 22.7 (0.8) 13.6 (0.7) 3.7 (0.3) 4.5 (0.3) 9.0 (0.6) 3.3 (0.4) 3.8 (0.3) 0.2 (0.1) 0.8 (0.2) 0
Difference 2013 −2.7* 9.0 (0.5) −0.5 6.2 (0.5) −2.1* 2.8 (0.1) 0.8 3.8 (0.4) 1.0* 2.5 (0.3) −0.1 0.9 (0.2) −0.3* 0.0 −0.1 0.1 (0) 9.9* 57.4 (2.5) 1.0* 1.3 (0.1) 12.6* 29.2 (1.8) −2.6 22.5 (1.5) −1.2* 4.4 (0.3) 5.9* 42.3 (1.1) −0.4 10.6 (0.6) 0.9 10.7 (0.6) 2.8 12.2 (0.4) 2.6 8.7 (0.6) 5.7 23.2 (0.8) 6.6 18.8 (0.8) 0.4 2.6 (0.2) −0.9* 1.8 (0.1) 6.5* 14.7 (1.2) 6.2* 9.9 (1.2) −0.7 2.6 (0.2) 0.5* 0.8
3 – 8 years old
Mean intake (standard error [SE]) (g/day) 2008 Difference 11.7 (0.8) −1.2 6.8 (0.7) 1.4* 4.9 (0.2) −2.6* 3.0 (0.4) 4.8 1.5 (0.2) 4.9 1.0 (0.2) −0.1 0.3 (0.1) 0.0 0.1 (0.1) −0.1 47.5 (2.7) 5.4 0.3 (0.2) 0.6* 16.6 (1.5) 7.2* 25.1 (2.0) −1.6 5.6 (0.5) −0.8 36.4 (1.3) 4.9* 10.9 (0.7) −0.1 9.8 (0.7) 0.3 9.5 (0.5) 2.3* 6.1 (0.6) 2.4* 17.5 (0.8) 4.2* 12.2 (0.8) 4.6* 2.2 (0.2) 0.1 2.6 (0.2) −0.3 8.2 (0.7) 3.0* 3.9
Table 6: Changes in the mean intake (g/day) of different food categories by age group between 2008 and 2013
1 – 2 years old
2008 2013 6.7 (0.6) 7.9 (0.6) 4.0 (0.5) 2.5 (0.5) 2.8 (0.3) 5.4 (0.4) 26.2 (1.8) 21.4 (1.9) 25.2 (1.7) 20.4 (1.8) 0.5 (0.2) 0.6 (0.3) 0.0 0.0 0.2 (0.1) 0.3 (0.2) 23.2 (2.1) 17.8 (2.0) 0.7 (0.2) 0.1 (0.0) 11.5 (1.5) 4.4 (1.1) 8.3 (1.1) 9.9 (1.6) 2.7 (0.3) 3.5 (0.5) 26.8 (1.1) 21.9 (1.2) 5.4 (0.5) 5.6 (0.6) 5.7 (0.6) 5.4 (0.7) 10.7 (0.5) 8.4 (0.6) 5.0 (0.5) 2.5 (0.4) 11.1 (0.9) 6.9 (0.6) 9.0 (0.9) 4.4 (0.5) 1.4
Difference −0.5 −0.1 −0.4 7.1 7.1 - - - 3.3 0.2 2.7 0.1 0.3 1.8 −0.2 0.6 1.3 0.0 0.4 0.3 0.1 0.0 6.7 2.3 0.3 0.5* 0.1 3.5
7 – 11 months old 2013 2.8 (1.0) 0.5 (0.3) 2.3 (1.0) 45.3 (4.6) 45.3 (4.6) 0 0 0 5.7 (2.2) 0.2 (0.2) 4.0 (2.0) 0.1 (0.1) 1.4 (1.0) 11.0 (1.1) 1.2 (0.4) 1.8 (0.6) 6.3 (0.8) 1.6 (0.5) 2.2 (0.6) 1.8 (0.6) 0.3 (0.2) 0.1 (0.1) 12.6 (2.9) 2.4 (1.6) 0.3 (0.3) 0.6 (0.3) 0.1 (0.1) 9.2 (2.6)
2008 3.3 (0.7) 0.6 (0.2) 2.7 (0.6) 38.2 (4.5) 38.2 (4.5) 0 0 0 2.4 (1.2) 0.0 1.4 (1.2) 0 1.0 (0.4) 9.2 (1.6) 1.4 (0.6) 1.1 (0.4) 5.0 (0.8) 1.6 (1.0) 1.8 (0.5) 1.4 (0.4) 0.2 (0.2) 0.2 (0.2) 5.9 (1.9) 0.1 (0.1) 0 0 0 5.7 (1.9)
Year (2008 and 2013) and the difference in Sugar (refined, second-class, and crude) (ii) Milk formula and milk products Milk formula for adults, infants, and children Ice cream and dairy products (iii) Non-alcoholic beverages Sweetened juice and other sweet drinks Biscuits, crackers, and cookies Cakes, pies, and pastries (v) Fish, meat, and poultry products Canned and processed meat Canned fish and seafood Dried and smoked fish and seafood
Characteristics Age group mean intake Food categories Processed food (i) Sugars and sweets Candies and jams Cheese Condensed milk Coffee and tea Soft drink Chocolate beverage (iv) Baked products Bread and pandesal Sweetbreads Breakfast cereal Infant cereal
Volume 2 Issue 1 (2024) 11 https://doi.org/10.36922/ghes.2060