
Page 160 - GHES-2-1
P. 160
Global Health Econ Sustain Total sugar consumption Philippines
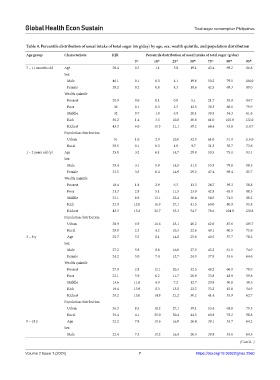
Table 4. Percentile distribution of usual intake of total sugar (in g/day) by age, sex, wealth quintile, and population distribution
Age group Characteristic IQR Percentile distribution of usual intake of total sugar (g/day)
5 th 10 th 25 th 50 th 75 th 90 th 95 th
7 – 11 months old Age 38.4 0.3 1.1 5.0 19.1 43.4 69.2 86.8
Sex
Male 46.1 0.1 0.5 4.1 19.6 50.2 79.5 104.0
Female 38.2 0.2 0.8 4.3 18.6 42.5 69.3 89.0
Wealth quintile
Poorest 20.9 0.0 0.1 0.8 5.1 21.7 55.9 84.7
Poor 36 0.1 0.3 2.3 12.5 38.3 66.6 79.9
Middle 32 0.7 1.9 6.9 20.1 38.9 54.3 61.6
Rich 50.2 1.4 3.3 10.8 30.8 61.0 102.0 132.0
Richest 43.3 6.0 10.3 21.1 39.2 64.4 93.8 114.7
Population distribution
Urban 51 1.0 2.0 10.0 32.0 61.0 91.0 116.0
Rural 29.5 0.1 0.3 1.8 9.7 31.3 58.7 73.6
1 – 2 years old (y) Age 35.8 3.2 6.1 14.7 29.9 50.5 75.1 93.1
Sex
Male 39.4 3.1 5.9 14.5 31.0 53.9 79.8 98.3
Female 32.5 3.5 6.4 14.9 29.0 47.4 69.4 85.7
Wealth quintile
Poorest 18.4 1.8 2.9 6.3 13.3 24.7 39.3 50.8
Poor 31.3 2.8 5.1 11.5 23.9 42.8 65.0 80.3
Middle 32.1 8.9 13.1 22.4 36.4 54.5 74.5 88.2
Rich 32.9 12.0 16.9 27.1 41.5 60.0 80.9 95.8
Richest 43.3 15.2 21.7 35.3 54.7 78.6 104.0 120.8
Population distribution
Urban 38.9 6.9 11.6 23.1 40.2 62.0 87.6 105.7
Rural 29.8 2.3 4.2 10.3 22.6 40.1 60.5 75.6
3 – 8 y Age 25.7 5.3 8.1 14.8 25.8 40.5 57.7 70.2
Sex
Male 27.2 5.8 8.8 16.0 27.5 43.2 61.5 74.9
Female 24.2 5.0 7.4 13.7 24.0 37.9 53.6 64.6
Wealth quintile
Poorest 27.9 2.8 12.1 20.3 32.5 48.2 66.0 78.9
Poor 22.1 5.9 6.2 11.7 20.9 33.8 48.9 59.8
Middle 13.6 11.6 4.0 7.2 12.7 20.8 30.8 38.3
Rich 19.4 13.9 8.3 13.8 22.2 33.2 45.8 54.9
Richest 20.2 15.0 14.8 21.2 30.2 41.4 53.9 62.7
Population distribution
Urban 26.3 8.5 18.2 27.1 39.1 53.4 68.8 79.5
Rural 30.4 4.1 20.0 30.4 44.5 60.8 78.2 90.8
9 – 18 y Age 22.2 7.8 10.6 16.9 26.4 39.1 53.7 64.2
Sex
Male 22.4 7.5 10.2 16.4 26.0 38.8 53.6 64.3
(Cont’d...)
Volume 2 Issue 1 (2024) 7 https://doi.org/10.36922/ghes.2060