
Page 145 - GHES-2-4
P. 145
Global Health Economics and
Sustainability
Silver economy and long-term care
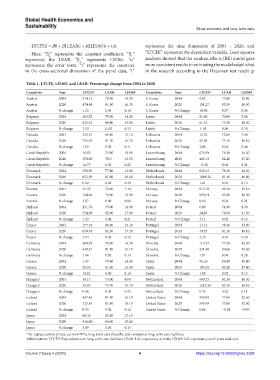
LTCFEit = b0 + b1LEABit + b2LEO65it + uit. represents the time dimension of 2004 – 2020, and
Here, “β ” represents the constant coefficient, “β ” “LTCFE” represents the dependent variable. Least squares
0
1
represents the LEAB, “β ” represents LEO65, “u” analyses showed that the random effects (RE) model gave
2
represents the error term, “i” represents the countries more consistent results in estimating the model established
in the cross-sectional dimension of the panel data, “t” in the research according to the Hausman test result (p
Table 1. LTCFE, LEO65, and LEAB: Percentage change from 2004 to 2020
Countries Year LTCFE* LEAB LEO65 Countries Year LTCFE* LEAB LEO65
Austria 2004 214.12 79.30 14.30 S. Korea 2004 4.83 77.80 12.80
Austria 2020 474.84 81.30 16.30 S. Korea 2020 101.27 83.50 18.50
Austria % change 1.22 0.03 0.14 S. Korea % Change 19.96 0.07 0.45
Belgium 2004 303.52 79.00 14.00 Latvia 2004 21.00 70.90 5.90
Belgium 2020 642.44 80.80 15.80 Latvia 2020 61.44 75.50 10.50
Belgium % change 1.12 0.,02 0.13 Latvia % Change 1. 93 0.06 0.78
Canada 2004 342.51 80.10 15.10 Lithuania 2004 12.32 72.00 7.00
Canada 2020 736.05 81.70 16.70 Lithuania 2020 47.98 75.10 10.10
Canada % change 1.15 0.02 0.11 Lithuania % Change 2.89 0.04 0.44
Czech Republic 2004 16.92 75.90 10.90 Luxembourg 2004 674.59 79.20 14.20
Czech Republic 2020 300.69 78.0 13.30 Luxembourg 2020 486.13 82.20 17.20
Czech Republic % change 16.77 0.03 0.22 Luxembourg % Change −0.28 0.04 0.21
Denmark 2004 358.83 77.80 12.80 Netherlands 2004 830.32 79.30 14.30
Denmark 2020 652.59 81.60 16.60 Netherlands 2020 1669.20 81.40 16.40
Denmark % change 0.82 0.05 0.30 Netherlands % Change 1.01 0.03 0.15
Estonia 2004 45.33 72.40 7.40 Norway 2004 613.78 80.10 15.10
Estonia 2020 184.66 78.90 13.90 Norway 2020 993.91 83.30 18.30
Estonia % change 3.07 0.09 0.88 Norway % Change 0.62 0.04 0.21
Finland 2004 251.76 79.00 14.00 Poland 2004 6.00 74.90 9.90
Finland 2020 534.90 82.00 17.00 Poland 2020 24.65 76.50 11.50
Finland % change 1.12 0.04 0.21 Poland % Change 3.11 0.02 0.16
France 2004 157.36 80.40 15.40 Portugal 2004 13.31 78.40 13.40
France 2020 650.78 82.30 17.30 Portugal 2020 44.55 81.10 16.10
France % change 3.14 0.02 0.12 Portugal % Change 2.35 0.03 0.20
Germany 2004 300.23 79.30 14.30 Slovenia 2004 110.27 77.20 12.20
Germany 2020 649.81 81.10 16.10 Slovenia 2020 221.40 80.60 15.60
Germany % change 1.16 0.02 0.13 Slovenia % Change 1.01 0.04 0.28
Greece 2004 1.37 79.40 14.40 Spain 2004 95.16 80.40 15.40
Greece 2020 28.55 81.40 16.40 Spain 2020 195.55 82.40 17.40
Greece % change 19.81 0.03 0.14 Spain % Change 1.05 0.02 0.13
Hungary 2004 38.17 73.00 8.00 Switzerland 2004 690.25 81.30 16.30
Hungary 2020 70.83 75.70 10.70 Switzerland 2020 1212.59 83.10 18.10
Hungary % change 0.86 0.04 0.34 Switzerland % Change 0.76 0.02 0.11
Iceland 2004 467.46 81.10 16.10 United States 2004 358.85 77.60 12.60
Iceland 2020 723.85 83.10 18.10 United States 2020 593.93 77.00 12.00
Iceland % change 0.55 0.02 0.12 United States % Change 0.66 −0.01 −0.05
Japan 2004 68.35 82.10 17.10
Japan 2020 416.00 84.60 19.60
Japan % change 5.09 0.03 0.15
*Per capita, current prices, current PPPs, long-term care (health), and residential long-term care facilities.
Abbreviations: LTCFE: Expenditures on long-term care facilities; LEAB: Life expectancy at birth; LEO65: Life expectancy at 65 years and over.
Volume 2 Issue 4 (2024) 4 https://doi.org/10.36922/ghes.3298