
Page 83 - GHES-2-4
P. 83
Global Health Economics and
Sustainability
NHIS: Acceptability and preferred benefit package
group of 31 – 40 years, measuring 156 people (43.9%), About half of the respondents (184; 52.5%) had household
and 134 (38.2%) were in the 41 – 50 years age group. The members between 5 and 7. A third of the respondents (106;
majority of the respondents were males (208; 59.3%), 30.2%) receive incomes between N90,000 and N139,999.
married (251; 71.5%), Christian (351; 100%), and tertiary- One in five of the respondents (77; 21.9) belongs to the rich
educated individuals (292; (83.2%). socioeconomic class. Only 8.5% of the respondents (n = 30)
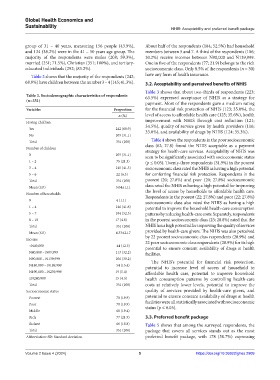
Table 2 shows that the majority of the respondents (242; have any form of health insurance.
68.9%) have children between the number 3 – 4 (145; 41.3%). 3.2. Acceptability and perceived benefits of NHIS
Table 3 shows that about two-thirds of respondents (223;
Table 2. Sociodemographic characteristics of respondents 63.5%) expressed acceptance of NHIS as a strategy for
(n=351)
payment. Most of the respondents gave a medium rating
Variables Proportion for the financial risk protection of NHIS (123; 35.0%), the
n (%) level of access to affordable health care (125; 35.6%), health
Having children improvement with NHIS through cost reduction (121;
Yes 242 (68.9) 34.5%), quality of service given by health providers (116;
33.0%), and availability of drugs by NHIS (124; 35.3%).
No 109 (31.1)
Total 351 (100) Table 4 shows the respondents in the poor socioeconomic
Number of children class (62; 27.8) found the NHIS acceptable as a payment
strategy for health-care services. Acceptability of NHIS was
0 109 (31.1) seen to be significantly associated with socioeconomic status
1 – 2 75 (21.3) (p ≤ 0.05). Twenty-three respondents (31.9%) in the poorest
3 – 4 145 (41.3) socioeconomic class rated the NHIS as having a high potential
5 – 6 22 (6.3) for conferring financial risk protection. Respondents in the
Total 351 (100) poorest (20; 27.8%) and poor (20; 27.8%) socioeconomic
Mean (SD) 3.04±1.11 class rated the NHIS as having a high potential for improving
Number of households the level of access by households to affordable health care.
Respondents in the poorest (22; 27.8%) and poor (22; 27.8%)
0 4 (1.1) socioeconomic class also rated the NHIS as having a high
1 – 4 146 (41.6) potential to improve the household health-care consumption
5 – 7 184 (52.5) patterns by reducing health-care costs. Separately, respondents
8 – 10 17 (4.8) in the poorest socioeconomic class (23; 28.8%) rated that the
Total 351 (100) NHIS has a high potential for improving the quality of services
Mean (SD) 4.33±2.17 provided by health-care givers. The NHIS was also perceived
Income by 22 poorest socioeconomic class respondents (28.9%) and
22 poor socioeconomic class respondents (28.9%) for its high
<N40,000 44 (12.5) potential to ensure constant availability of drugs at health
N40,000 – N89,999 113 (32.2) facilities.
N90,000 – N139,999 106 (30.2) The NHIS’s potential for financial risk protection,
N140,000 – N189,999 54 (15.4) potential to increase level of access of household to
N190,000 – N239,999 19 (5.4) affordable health care, potential to improve household
≥N240,000 15 (4.3) health consumption patterns by controlling health-care
Total 351 (100) costs at relatively lower levels, potential to improve the
Socioeconomic status quality of services provided by health-care givers, and
Poorest 70 (19.9) potential to ensure constant availability of drugs at health
Poor 70 (19.9) facilities were all statistically associated with socioeconomic
status (p ≤ 0.05).
Middle 68 (19.4)
Rich 77 (21.9) 3.3. Preferred benefit package
Richest 66 (18.8) Table 5 shows that among the surveyed respondents, the
Total 351 (100) package that covers all services stands out as the most
Abbreviation: SD: Standard deviation. preferred benefit package, with 178 (50.7%) expressing
Volume 2 Issue 4 (2024) 5 https://doi.org/10.36922/ghes.2909