
Page 84 - GHES-2-4
P. 84
Global Health Economics and
Sustainability
NHIS: Acceptability and preferred benefit package
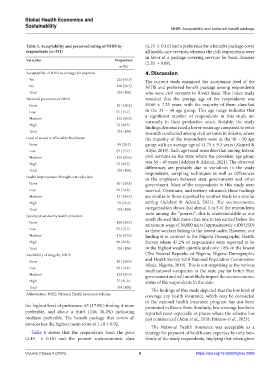
Table 3. Acceptability and perceived rating of NHIS by (4.19 ± 0.11) had a preference for a benefits package cover
respondents (n=351) all health-care services, whereas the rich respondents were
in favor of a package covering services for basic diseases
Variables Proportion (2.20 ± 0.08).
n (%)
Acceptability of NHIS as strategy for payment 4. Discussion
Yes 223 (63.5) The current study examined the acceptance level of the
No 128 (36.5) NHIS and preferred benefit package among respondents
Total 351 (100) who were civil servants in Rivers State. This index study
Financial protection of NHIS revealed that the average age of the respondents was
None 101 (28.8) 40.60 ± 7.33 years, with the majority of them classified
Low 55 (15.7) in the 31 – 40 age group. This age range indicates that
Medium 123 (35.0) a significant number of respondents in this study are
currently in their productive years. Notably, the study
High 72 (20.5) findings demonstrated a lower mean age compared to prior
Total 351 (100) research conducted among civil servants in Sokoto, where
Level of access to affordable Healthcare the majority of the respondents were in the 40 – 50 age
None 99 (28.2) group with an average age of 41.75 ± 9.3 years (Ahmed &
Low 55 (15.7) Aliyu, 2019). Such age trend resembles that among federal
Medium 125 (35.6) civil servants in the state where the prevalent age group
High 72 (20.5) was 36 – 45 years (Adebiyi & Adeniji, 2021). The observed
differences are probably due to variations in the study
Total 351 (100) respondents, sampling techniques as well as differences
Health improvement through cost reduction in the employers between state governments and other
None 101 (28.8) government. Most of the respondents in this study were
Low 50 (14.2) married, Christians, and tertiary-educated; these findings
Medium 121 (34.5) are similar to those reported by another study in a similar
High 79 (22.5) setting (Adebiyi & Adeniji, 2021). The socioeconomic
Total 351 (100) categorization shows that almost 1 in 5 of the respondents
Quality of service by health providers were among the “poorest”; this is understandable as our
result showed that more than one in ten earned below the
None 100 (28.5) minimum wage of 30,000 naira (approximately <100 USD)
Low 55 (15.7) as these workers belong to the lowest cadre. However, our
Medium 116 (33.0) finding is in contrast to the Nigeria Demographic Health
High 80 (22.8) Survey where 47.2% of respondents were reported to be
Total 351 (100) in the highest wealth quintile and only 1.8% in the lowest
Availability of drugs by NHIS (The Federal Republic of Nigeria, Nigeria Demographic
and Health Survey 2018 National Population Commission
None 101 (28.8)
Low 50 (14.2) Abuja, Nigeria, 2019). This is not surprising as the various
multinational companies in the state pay far better than
Medium 124 (35.3) government and will most likely impact the socioeconomic
High 77 (21.9) status of the respondents in the state.
Total 351 (100)
The findings of this study depicted that the low level of
Abbreviation: NHIS: National Health Insurance Scheme. coverage any health insurance, which may be connected
to the national health insurance program has just been
the highest level of preference, 63 (17.9%) finding it more promoted in Rivers State. Similarly, low coverage has been
preferable, and about a third (106; 30.2%) indicating reported most especially in places where the scheme has
medium preferable. The benefit package that covers all just commenced (Amu et al., 2018; Erinoso et al., 2023).
services has the highest mean score of 4.18 ± 0.92.
The National Health Insurance was acceptable as a
Table 6 shows that the respondents from the poor strategy for payment of health-care expenses by only two-
(4.49 ± 0.10) and the poorest socioeconomic class thirds of the study respondents, implying that when given
Volume 2 Issue 4 (2024) 6 https://doi.org/10.36922/ghes.2909