
Page 116 - GHES-3-2
P. 116
Global Health Economics and
Sustainability
Hospitalizations due to obesity and deaths from diabetes
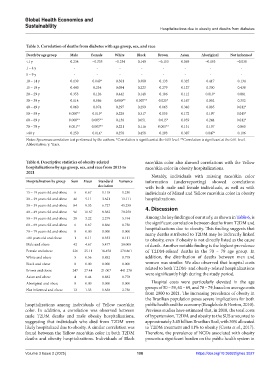
Table 3. Correlation of deaths from diabetes with age group, sex, and race
Death by age group Male Female White Black Brown Asian Aboriginal Not informed
<1 y 0.234 −0.335 −0.254 0.149 −0.153 0.069 −0.103 −0.038
1 – 4 y - - - - - - - -
5 – 9 y - - - - - - - -
10 – 14 y 0.139 0.049* 0.301 0.380 0.133 0.325 0.417 0.134
15 – 19 y 0.440 0.234 0.094 0.223 0.279 0.127 0.300 0.438
20 – 29 y 0.353 0.126 0.442 0.148 0.106 0.112 0.019* 0.081
30 – 39 y 0.114 0.086 0.000** 0.007** 0.025* 0.167 0.052 0.302
40 – 49 y 0.060 0.074 0.297 0.299 0.065 0.340 0.085 0.012*
50 – 59 y 0.000** 0.019* 0.228 0.317 0.055 0.172 0.197 0.015*
60 – 69 y 0.000** 0.005** 0.138 0.051 0.015* 0.059 0.244 0.012*
70 – 79 y 0.001** 0.003** 0.221 0.116 0.005** 0.131 0.157 0.060
>80 y 0.250 0.014* 0.278 0.458 0.203 0.387 0.047* 0.106
Notes: Spearman correlation test performed by the authors. *Correlation is significant at the 0.05 level. **Correlation is significant at the 0.01 level.
Abbreviation: y: Years.
Table 4. Descriptive statistics of obesity‑related race/skin color also showed correlations with the Yellow
hospitalizations by age group, sex, and race from 2013 to race/skin color in obesity hospitalizations.
2021
Notably, individuals with missing race/skin color
Hospitalization by group Sum Mean Standard Variance information (underreporting) showed correlations
deviation with both male and female individuals, as well as with
15 – 19 years old and obese 6 0.67 1.118 1.250 individuals of Mixed and Yellow race/skin color in obesity
20 – 29 years old and obese 46 5.11 3.621 13.111 hospitalizations.
30 – 39 years old and obese 84 9.33 6.727 45.250 4. Discussion
40 – 49 years old and obese 96 10.67 8.382 70.250
50 – 59 years old and obese 29 3.22 2.279 5.194 Among the key findings of our study, as shown in Table 6, is
60 – 69 years old and obese 6 0.67 0.866 0.750 the significant correlation between deaths from T2DM and
70 – 79 years old and obese 0 0.00 0.000 0.000 hospitalizations due to obesity. This finding suggests that
many deaths attributed to T2DM may be indirectly linked
>80 years old and obese 1 0.11 0.333 0.111 to obesity, even if obesity is not directly listed as the cause
Male and obese 42 4.67 5.477 30.000 of death. Another notable finding is the highest prevalence
Female and obese 226 25.11 16.458 270.861 of T2DM-related deaths in the 70 – 79 age group. In
White and obese 5 0.56 0.882 0.778 addition, the distribution of deaths between men and
Black and obese 0 0.00 0.000 0.000 women was similar. We also observed that hospital costs
Brown and obese 247 27.44 21.007 441.278 related to both T2DM- and obesity-related hospitalizations
were significantly high during the study period.
Asian and obese 4 0.44 0.882 0.778
Aboriginal and obese 0 0.00 0.000 0.000 Hospital costs were particularly elevated in the age
groups of 50 – 59, 60 – 69, and 70 – 79, based on average costs
Not informed and obese 12 1.33 1.658 2.750
from 2000 to 2021. The increasing prevalence of obesity in
the Brazilian population poses severe implications for both
hospitalizations among individuals of Yellow race/skin public health and the economy (Beaglehole & Horton, 2010).
color. In addition, a correlation was observed between Previous studies have estimated that, in 2018, the total costs
male T2DM deaths and male obesity hospitalizations, of hypertension, T2DM, and obesity to the SUS amounted to
suggesting that individuals who died from T2DM were approximately 3.45 billion Brazilian Real, with 30% allocated
likely hospitalized due to obesity. A similar correlation was to T2DM treatment and 11% to obesity (Costa et al., 2017).
found between the Yellow race/skin color in both T2DM Therefore, the prevalence of NCDs associated with obesity
deaths and obesity hospitalizations. Individuals of Black presents a significant burden on the public health system in
Volume 3 Issue 2 (2025) 108 https://doi.org/10.36922/ghes.3027