
Page 114 - GHES-3-2
P. 114
Global Health Economics and
Sustainability
Hospitalizations due to obesity and deaths from diabetes
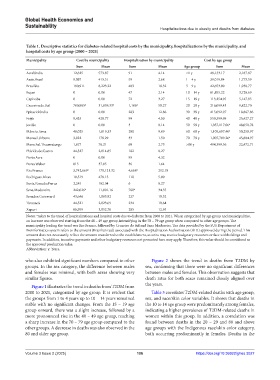
Table 1. Descriptive statistics for diabetes‑related hospital costs by the municipality, hospitalizations by the municipality, and
hospital costs by age group (2000 – 2021)
Municipality Cost by municipality Hospitalization by municipality Cost by age group
Sum Mean Sum Mean Age group Sum Mean
Acrelândia 12,625 573.87 91 4.14 <1 y 48,133.17 2,187.87
Assis.Brasil 9,097 413.51 59 2.68 1 – 4 y 39,019.04 1,773.59
Brasiléia 180,911 8,223.22 403 18.32 5 – 9 y 42,653.00 1,938.77
Bujari 0 0.00 47 2.14 10 – 14 y 81,855.22 3,720.69
Capixaba 0 0.00 72 3.27 15 – 19 y 113,254.95 5,147.95
Cruzeiro.do.Sul 700,905 a 31,859.33 a 1,106 a 50.27 20 – 29 y 216,099.43 9,822.70
Epitaciolândia 0 0.00 283 12.86 30 – 39 y 415,092.97 18,867.86
Feijó 9,433 428.77 99 4.50 40 – 49 y 559,399.98 25,427.27
Jordão 0 0.00 3 0.14 50 – 59 y 1,057,117.06 a 48,050.78
Mâncio.Lima 40,025 1,819.33 200 9.09 60 – 69 y 1,105,697.40 a 50,258.97
Manoel.Urbano 3,922 178.29 33 1.50 70 – 79 y 1,007,709.26 a 45,804.97
Marechal.Thaumaturgo 1,677 76.21 60 2.73 >80 y 494,399.56 22,472.71
Plácido.de.Castro 44,327 2,014.85 182 8.27
Porto.Acre 0 0.00 95 4.32
Porto.Walter 815 37.05 36 1.64
Rio.Branco 3,742,669 a 170,121.32 4,668 a 212.18
Rodrigues.Alves 10,519 478.15 110 5.00
Santa.Rosa.do.Purus 2,245 102.04 6 0.27
Sena.Madureira 242,026 a 11,001.16 760 a 34.55
Senador.Guiomard 43,646 1,983.92 227 10.32
Tarauacá 44,521 2,023.69 234 10.64
Xapuri 86,959 3,952.70 285 12.95
Notes: refers to the trend of hospitalizations and hospital costs due to diabetes from 2000 to 2021. When categorized by age group and municipalities,
a
an increase was observed starting from the 40 – 49 age group, intensifying in the 70 – 79 age group when compared to other age groups. The
municipality leading the trend was Rio Branco, followed by Cruzeiro do Sul and Sena Madureira. The data provided by the SUS Department of
Bioinformatics system refers to the amount (Brazilian real) associated with the Hospitalization Authorization (AIH) approved during the period. This
amount does not necessarily reflect the amount transferred to the establishment, as units may receive budgetary resources or face withholdings and
payments. In addition, incentive payments and other budgetary resources not presented here may apply. Therefore, this value should be considered as
the approved production value.
Abbreviation: y: Years.
who also exhibited significant numbers compared to other Figure 2 shows the trend in deaths from T2DM by
groups. In the sex category, the difference between males sex, confirming that there were no significant differences
and females was minimal, with both sexes showing very between males and females. This observation suggests that
similar figures. death rates for both sexes remained closely aligned over
Figure 1 illustrates the trend in deaths from T2DM from the years.
2000 to 2021, categorized by age group. It is evident that Table 3 correlates T2DM-related deaths with age group,
the groups from 1 to 4 years up to 10 – 14 years remained sex, and race/skin color variables. It shows that deaths in
stable with no significant changes. From the 15 – 19 age the 10 to 14 age group were predominantly among females,
group onward, there was a slight increase, followed by a indicating a higher prevalence of T2DM-related deaths in
more pronounced rise in the 40 – 49 age group, reaching women within this group. In addition, a correlation was
a sharp increase in the 70 – 79 age group compared to the found between deaths in the 20 – 29 and 80 and above
other groups. A decrease in deaths was also observed in the age groups with the Indigenous race/skin color category,
80 and older age group. both occurring predominantly in females. Deaths in the
Volume 3 Issue 2 (2025) 106 https://doi.org/10.36922/ghes.3027