
Page 115 - GHES-3-2
P. 115
Global Health Economics and
Sustainability
Hospitalizations due to obesity and deaths from diabetes
Table 2. Descriptive statistics of deaths from diabetes by age
group, sex, and race/color from 2013 to 2021
Death by group Minimum Maximum Sum Average
<1 y 0 1 4 0.18
1 – 4 y 0 0 0 0.00
5 – 9 y 0 0 0 0.00
10 – 14 y 0 1 1 0.05
15 – 19 y 0 1 5 0.23
20 – 29 y 0 3 9 0.41
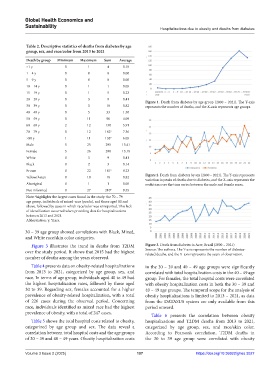
Figure 1. Death from diabetes by age group (2000 – 2021). The Y-axis
30 – 39 y 0 3 18 0.82 represents the number of deaths, and the X-axis represents age groups.
40 – 49 y 0 5 33 1.50
50 – 59 y 0 11 90 4.09
60 – 69 y 2 12 130 5.91
70 – 79 y 0 12 162 a 7.36
>80 y 1 11 133 a 6.05
Male 5 25 295 13.41
Female 5 26 290 13.18
White 0 3 9 0.41
Black 0 2 3 0.14
Brown 0 22 181 a 8.23
Yellow/Asian 0 10 18 0.82 Figure 2. Death from diabetes by sex (2000 – 2021). The Y-axis represents
variation in peaks of deaths due to diabetes, and the X-axis represents the
Aboriginal 0 1 1 0.05 evolution over the time series between the male and female sexes.
Not informed 0 27 210 a 9.55
Note: highlights the largest cases found in the study: the 70 – 79
a
age group, individuals of mixed-race (parda), and those aged 80 and
above, followed by cases in which race/color was unreported. This lack
of identification occurred when providing data for hospitalizations
between 2013 and 2021.
Abbreviation: y: Years.
30 – 39 age group showed correlations with Black, Mixed,
and White race/skin color categories.
Figure 3 illustrates the trend in deaths from T2DM Figure 3. Death from diabetes in Acre, Brazil (2000 – 2021)
over the study period. It shows that 2015 had the highest Source: The authors. The Y-axis represents the number of diabetes-
related deaths, and the X-axis represents the years of observation.
number of deaths among the years observed.
Table 4 presents data on obesity-related hospitalizations in the 30 – 39 and 40 – 49 age groups were significantly
from 2013 to 2021, categorized by age group, sex, and correlated with total hospitalization costs in the 40 – 49 age
race. In terms of age group, individuals aged 40 to 49 had group. For females, the total hospital costs were correlated
the highest hospitalization rates, followed by those aged with obesity hospitalization costs in both the 30 – 39 and
30 to 39. Regarding sex, females accounted for a higher 40 – 49 age groups. The temporal scope for the analysis of
prevalence of obesity-related hospitalization, with a total obesity hospitalizations is limited to 2013 – 2021, as data
of 226 cases during the observed period. Concerning from the DATASUS system are only available from this
race, individuals identified as mixed race had the highest period onward.
prevalence of obesity, with a total of 247 cases.
Table 6 presents the correlation between obesity
Table 5 shows the total hospital costs related to obesity, hospitalizations and T2DM deaths from 2013 to 2021,
categorized by age group and sex. The data reveal a categorized by age group, sex, and race/skin color.
correlation between total hospital costs and the age groups According to Pearson’s correlation, T2DM deaths in
of 30 – 39 and 40 – 49 years. Obesity hospitalization costs the 30 to 39 age group were correlated with obesity
Volume 3 Issue 2 (2025) 107 https://doi.org/10.36922/ghes.3027