
Page 200 - GHES-3-2
P. 200
Global Health Economics and
Sustainability
Gender inequality and healthcare
where higher income does not necessarily translate into Figure 6 displays the association between unemployment
increased investment in education and HIV prevention for rate and mortality rate by region for both males
women. (Figure 6A) and females (Figure 6B). The size of the bubble
Figure 5 depicts the trend of mortality rates for males is proportional to the mortality rate, while the intensity
(blue line) and females (pink line) at different income levels. of the color is proportional to the unemployment rate.
Female mortality rates are lower than males in middle- Africa and Europe have high rates of unemployment and
income and high-income countries, but not so in low-income mortality for both genders. In contrast, the unemployment
countries. This suggests that in low-income countries, less and mortality rates are generally higher for females than
attention and resources are allocated to women’s health, for males in Asia, Africa, North America, and South
leading to increased mortality rates among females. America. Higher unemployment is associated with higher
mortality rates. Therefore, policymakers should consider the
3.3. Gender inequality, employment, and health association between employment and healthcare in framing
outcomes national policies aimed at gender equity.
It is important to explore whether gender inequality in Figure 7 presents the yearly trend of unemployment
employment is associated with health outcomes, such as (pink bars) and fertility rates (purple line) for females.
mortality, fertility rate, HIV incidence, and life expectancy, Average fertility rates have been declining globally since
among others. 2006, while the unemployment rate has fluctuated, peaking
around 2010 – 2013. In general, the unemployment rate
is proportional to the fertility rate, suggesting that as
A
more women gain employment and the standard of living
improves, they may choose to have fewer children.
Figure 8 displays the association between the
unemployment rate and HIV incidence for males
(Figure 8A) and females (Figure 8B) at different income
levels. In middle-income and low-income countries,
B
unemployment is higher for women than for men. However,
HIV incidents are more frequent for men than women. In
these countries, higher unemployment in men is correlated
with a higher incidence of HIV compared to women.
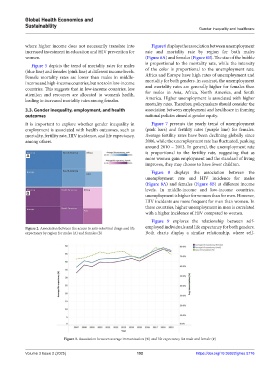
Figure 9 explores the relationship between self-
Figure 2. Association between the access to anti-retroviral drugs and life employed individuals and life expectancy for both genders.
expectancy by region for males (A) and females (B) Both charts display a similar relationship, where self-
Figure 3. Association between average immunization (%) and life expectancy for male and female (#)
Volume 3 Issue 2 (2025) 192 https://doi.org/10.36922/ghes.5776