
Page 201 - GHES-3-2
P. 201
Global Health Economics and
Sustainability
Gender inequality and healthcare
employed work (described as household work) decreased The study further explores women’s employment
over the years, while life expectancy increased. There (represented by women in the parliament) and its
seems to be no difference between the percentage of males association with health outcomes. Figure 10 displays the
and females who are self-employed, not in its impact on percentage of seats held by women in parliament (lines)
life expectancy. and the female life expectancy (bars) at the various income
levels. Female representation in parliament has been
A increasing across all three income levels. The average
life expectancy for females has also increased over time,
with low-income countries exhibiting the slowest growth
rate among the three groups. Low-income countries may
lack the initiative to promote women to government and
decision-making roles, which may be a contributing factor
to the female life expectancy lagging behind that of higher-
income countries.
Figure 11 displays the association between women in
parliament and fertility rates by region. The size of the
box indicates the percentage of women in parliament;
the color intensity represents the fertility rate of women.
B
Africa has the highest average fertility rate with a
relatively lower representation of women in parliament.
Europe has a slightly higher representation of women
in parliament, but a very low fertility rate. In general,
a higher representation of women in parliamentary
jobs appears to correspond to lower fertility rates in
women. This could be due to the challenges faced by
working women due to the demands of the job, in terms
of having or raising children. The findings provide
insights for future employment policies to consider
childcare resources as a motivating factor for working
women.
Figure 12 illustrates the association between the
Figure 4. Human immunodeficiency virus incidence among males percentage of government positions held by women and
(A) and females (B) by income level HIV incidence among females for the period of study. Over
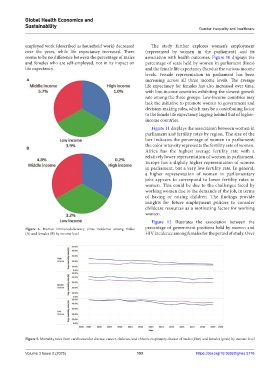
Figure 5. Mortality rates from cardiovascular disease, cancer, diabetes, and chronic respiratory disease of males (blue) and females (pink) by income level
Volume 3 Issue 2 (2025) 193 https://doi.org/10.36922/ghes.5776