
Page 74 - GHES-3-2
P. 74
Global Health Economics and
Sustainability
Climate change and quality of life
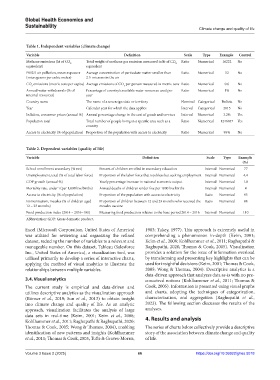
Table 1. Independent variables (climate change)
Variable Definition Scale Type Example Control
Methane emissions (kt of CO 2 Total weight of methane gas emission measured in kt of CO Ratio Numerical 16222 No
2
equivalent) equivalent
PM2.5 air pollution, mean exposure Average concentration of particulate matter smaller than Ratio Numerical 52 No
(micrograms per cubic meter) 2.5 microns in the air
CO emissions (metric tons per capita) Average emissions of CO per person measured in metric tons Ratio Numerical 0.6 No
2 2
Annual water withdrawals (% of Percentage of country’s available water resources used per Ratio Numerical 1% No
internal resources) year
Country name The name of a sovereign state or territory Nominal Categorical Bolivia No
Year Calendar year for which the data applies Interval Categorical 2015 No
Inflation, consumer prices (annual %) Annual percentage change in the cost of goods and services Interval Numerical 3.2% Yes
Population total Total number of people living in a specific area such as a Ratio Numerical 1246847 Yes
country
Access to electricity (% of population) Proportion of the population with access to electricity Ratio Numerical 95% No
Table 2. Dependent variables (quality of life)
Variable Definition Scale Type Example
(%)
School enrollment secondary (% net) Percent of children enrolled in secondary education Interval Numerical 77
Unemployment, total (% of total labor force) Proportion of the labor force that is jobless but seeking employment Interval Numerical 4.4
GDP growth (annual %) Yearly percentage increase in national economic output Interval Numerical 1.8
Mortality rate, under i (per 1,000 live births) Annual deaths of children under five per 1000 live births Interval Numerical 4
Access to electricity (% of population) Proportion of the population with access to electricity Ratio Numerical 95
Immunization, measles (% of children aged Proportion of children between 12 and 23 months who received the Ratio Numerical 88
12 – 23 months) measles vaccine
Food production index (2014 – 2016=100) Measuring food production relative to the base period 2014 – 2016 Interval Numerical 110
Abbreviation: GDP: Gross domestic product.
Excel (Microsoft Corporation, United States of America) 1983; Tukey, 1977). This approach is extremely useful in
was utilized for reviewing and organizing the refined comprehending a phenomenon in-depth (Keim, 2001;
dataset, reducing the number of variables to a relevant and Keim et al., 2008; Kohlhammer et al., 2011; Raghupathi &
manageable number. On this dataset, Tableau (Salesforce Raghupathi, 2020; Thomas & Cook, 2005). Visualization
Inc., United States of America), a visualization tool, was provides a solution for the issue of information overload
utilized primarily to develop a series of interactive charts, by transforming and presenting key highlights that can be
applying the method of visual analytics to illustrate the used for insightful decisions (Keim, 2001; Thomas & Cook,
relationships between multiple variables. 2005; Wong & Thomas, 2004). Descriptive analytics is a
data-driven approach that analyzes data as-is with no pre-
3.4. Visual analytics conceived notions (Kohlhammer et al., 2011; Thomas &
The current study is empirical and data-driven and Cook, 2005). Information is presented using visual graphs
utilizes descriptive analytics as the visualization approach and charts, adopting the techniques of categorization,
(Börner et al., 2019; Sun et al., 2013) to obtain insight characterization, and aggregation (Raghupathi et al.,
into climate change and quality of life. As an analytic 2023). The following section discusses the results of the
approach, visualization facilitates the analysis of large analyses.
data sets in real-time (Keim, 2001; Keim et al., 2008;
Kohlhammer et al., 2011; Raghupathi & Raghupathi, 2020; 4. Results and analysis
Thomas & Cook, 2005; Wong & Thomas, 2004), enabling The series of charts below collectively provide a descriptive
identification of new patterns and insights (Kohlhammer story of the association between climate change and quality
et al., 2011; Thomas & Cook, 2005, Tufte & Graves-Morris, of life.
Volume 3 Issue 2 (2025) 66 https://doi.org/10.36922/ghes.5018